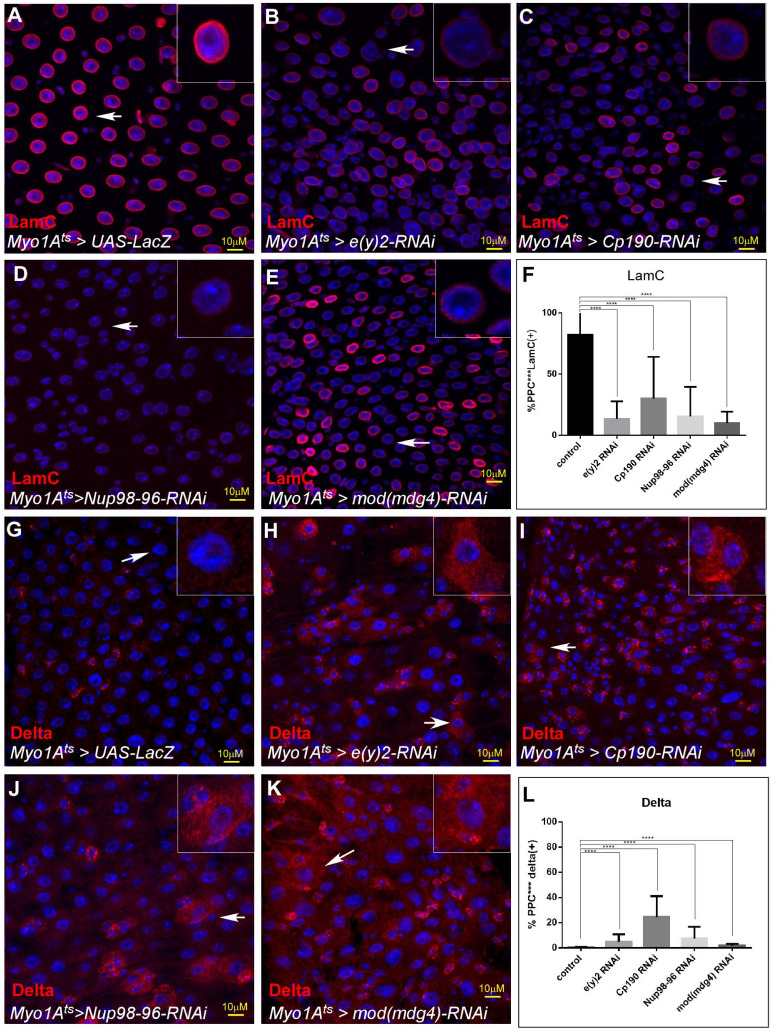
Figure 4. Non-stop identity complex (NIC) regulates EC identity.
Confocal images of the midgut tissue using the indicated antibodies; (A–E) LamC, (G–K) Delta, DAPI marks DNA (blue). The indicated transgenes were expressed in EC using the MyoIA-Gal4/Gal80ts system for forty-eight hours. (A, G) UAS-LacZ (B, H) UAS-e(y)2-RNAi; (C, I) UAS-CP190-RNAi;. (D, J) Nup98-96 (E, K) Mod (mdg4) White arrows points to cells shown in insets, and scale bar is 10 μM. Quantification is shown in (F) for LamC. and (L) for Delta.

