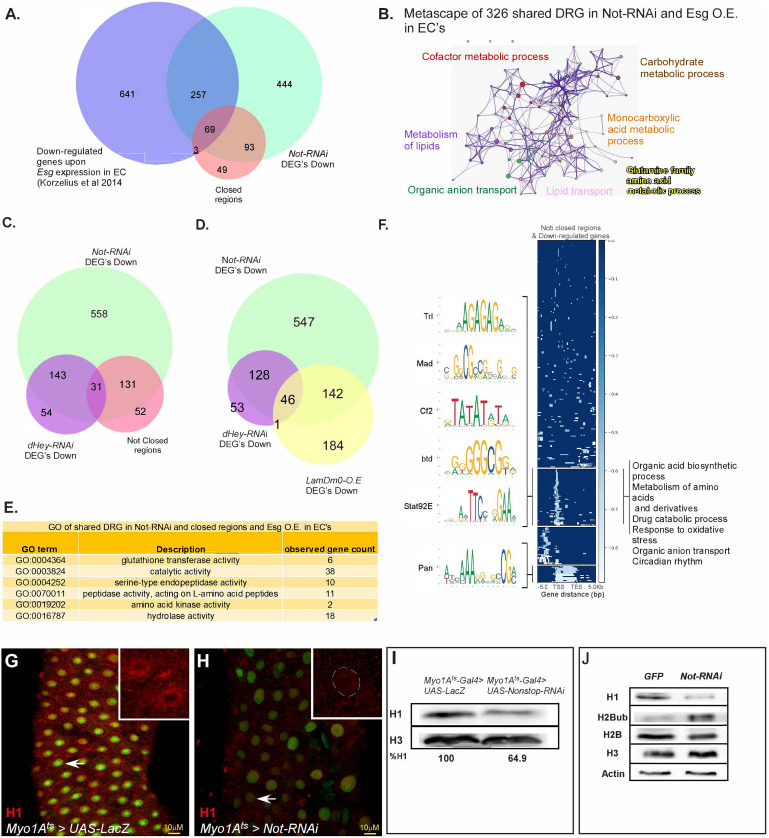
Figure 5. Not regulates EC-gene expression and is required for chromatin accessibility.
(A) Venn diagram comparing EC-related genes (Blue; Korzelius et al., 2014), genes exhibiting reduced expression upon loss of Not in ECs (Green), and chromatin regions with reduced accessibility upon loss of Not in ECs identified by ATAC-seq (Orange). (B) Metascape analysis of shared Non-stop-down-regulated genes and Esg over-expression in ECs. (C) Venn diagram comparison of genes that exhibit reduced expression upon loss of either Non-stop or Hey in ECs, as well as genes in the vicinity of regions showing reduced accessibility upon loss of Non-stop. (D) Venn diagram of genes that exhibit reduced expression upon loss of Non-stop or Hey and of genes with reduced expression upon over expression of LamDm0 in ECs (E) GO analysis of genes downregulated by loss of Non-stop in and Esg over-expression in ECs exhibiting reduced accessibility. Observed gene count; number of genes identified from this group in both ATAC-seq and RNA-seq (F) Genome-wide alignment and MEME analysis of regions with reduced accessibility in the vicinity of down-regulated genes upon loss of Non-stop in ECs. TSS, transcriptional start site; TES, transcription end site. (G–H) Confocal images of the midgut tissue using α-Histone H1 (red), and expressing the indicated transgenes in ECs using the MyoIA-Gal4/Gal80ts system for forty-eight hours, DAPI marks DNA (blue). (G) UAS-LacZ (control) (H), UAS-Non-stop RNAi. Scale bar is 10 μM. (I, J) western-blot analysis of the indicated proteins derived from gut extract (I), or S2 Drosophila cell extract (J) Histone H3 and Actin serve as loading controls.


