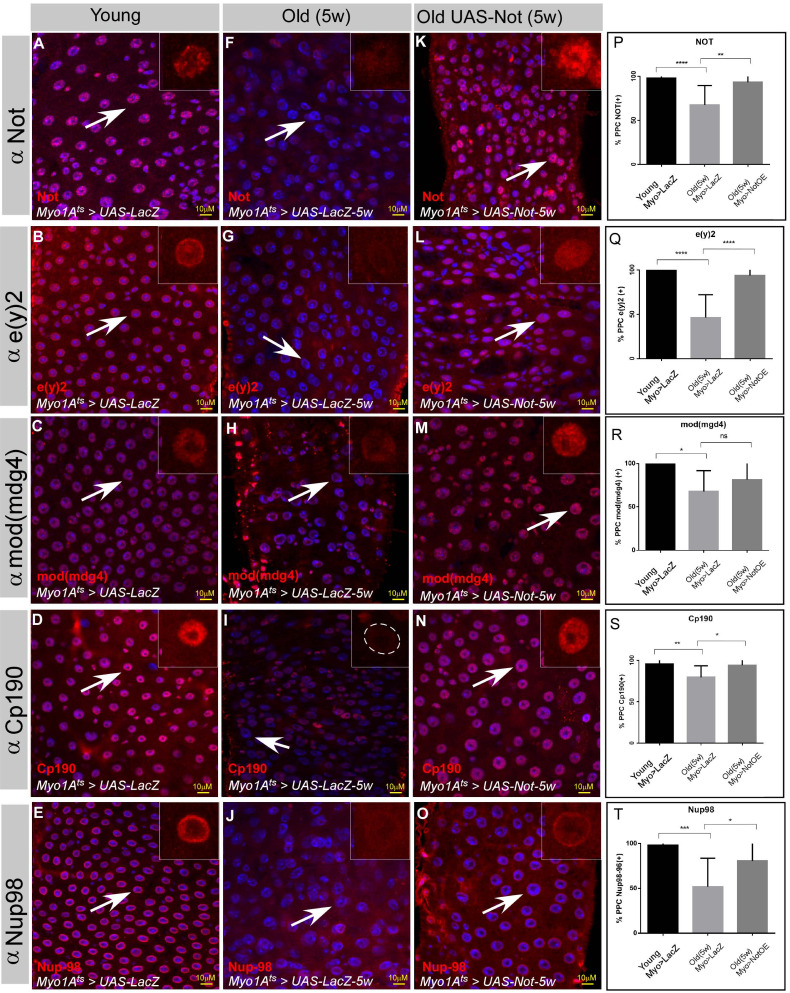
Figure 7. The protein levels of the Not-CP190 complex subunits decline upon aging and is restored upon continues expression of Non-stop in aged ECs.
(A–O) Representative confocal images of the midgut tissue using the indicated antibodies (red) and expressing the indicated transgenes in EC using the MyoIA-Gal4/Gal80ts system. (A–E) Young 4 days old guts, (F–J) Five weeks old guts expressing UAS-lacZ. (K–O) Five weeks old guts expressing UAS-Non-stop. DAPI marks DNA (blue), and scale bar is 10 μM. (P–T) Quantification of similar experiments presented in A-O. **** = P < 0.0001, ***P < 0.001; **P<0.01; *=P<0.1.

