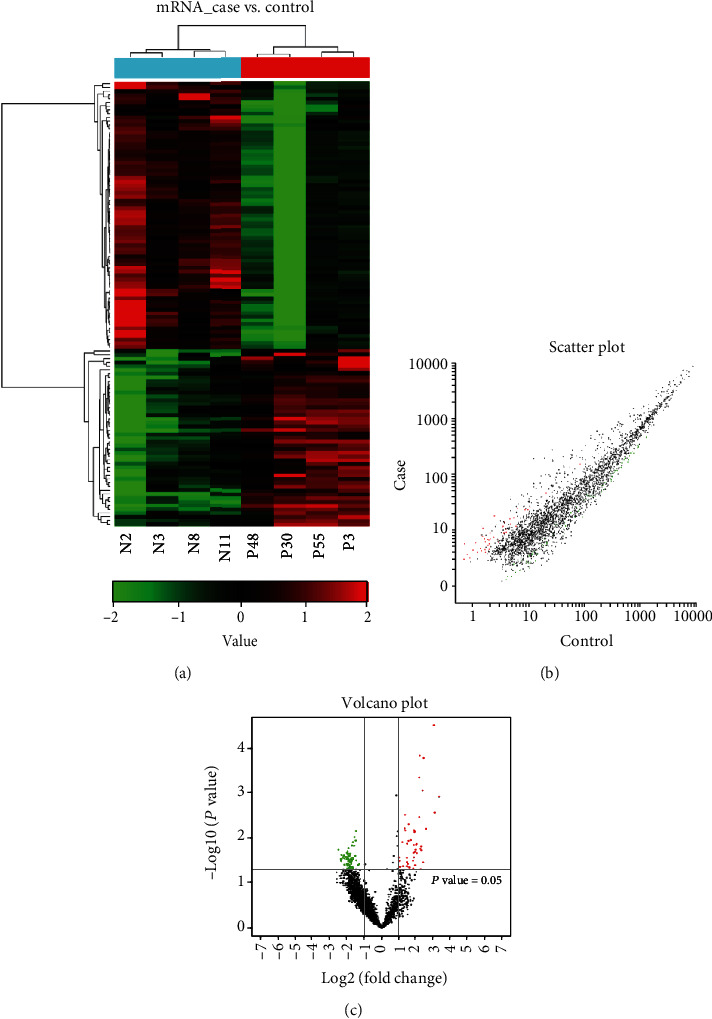
Figure 2.

The mRNA expression profile in ICP compared with controls. (a) Differently expressed mRNAs by hierarchical clustering analysis. Red represents upregulated genes, green represents downregulated genes, and the difference is more than 2 times. (b) Different expression of mRNAs by scatter plot. Red represents upregulated genes, green represents downregulated genes, and the difference is more than 2 times. (c) Different expression of mRNAs by volcano plot. Red represents upregulated genes, green represents downregulated genes, and the difference is more than 2 times.
