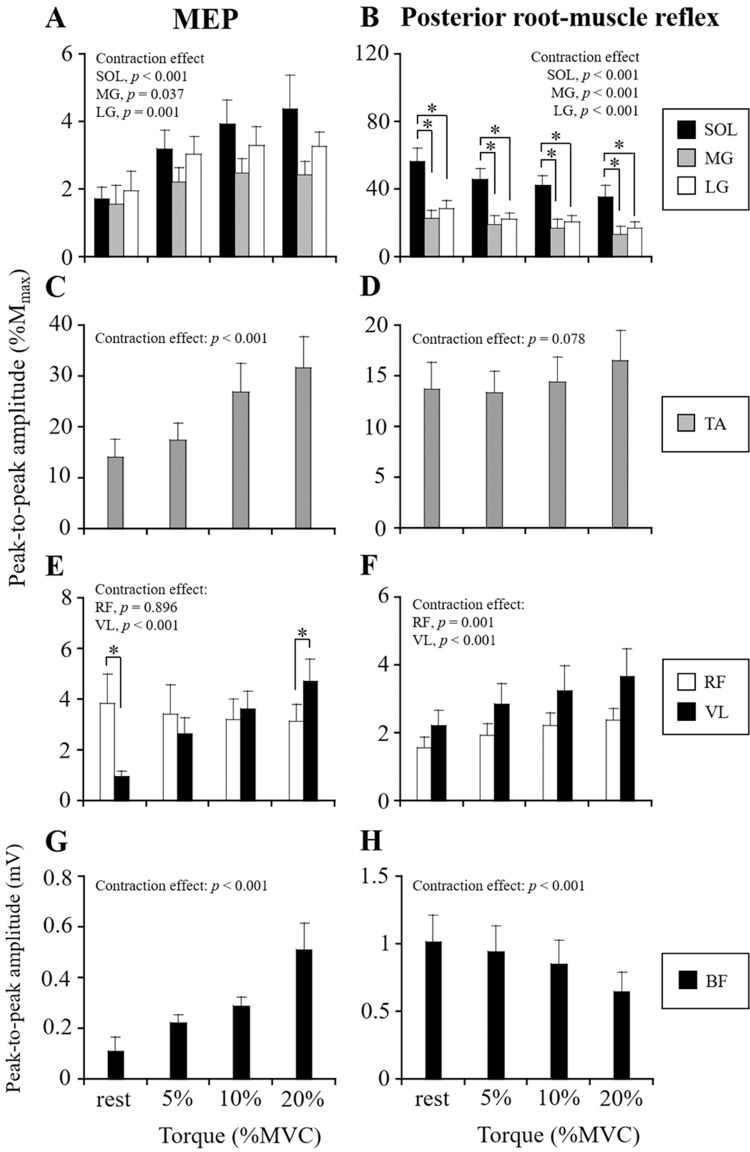
Fig. 3.
MEP (a, c, e, g) and posterior root-muscle reflex (b, d, f, h) amplitudes of antagonist muscles during resting and weak voluntary contraction. MEP and posterior root-muscle reflex amplitudes of triceps surae during dorsi-flexion (a, b), TA during plantar-flexion (c, d), quadriceps femoris during knee flexion (e, f), and BF during knee extension (g, h) are shown. Peak-to-peak amplitudes of MEPs and posterior root-muscle reflexes of each muscle are normalized by those of Mmax, except for BF. Values are expressed as means ± SE. *p < 0.05, significant difference between muscles

