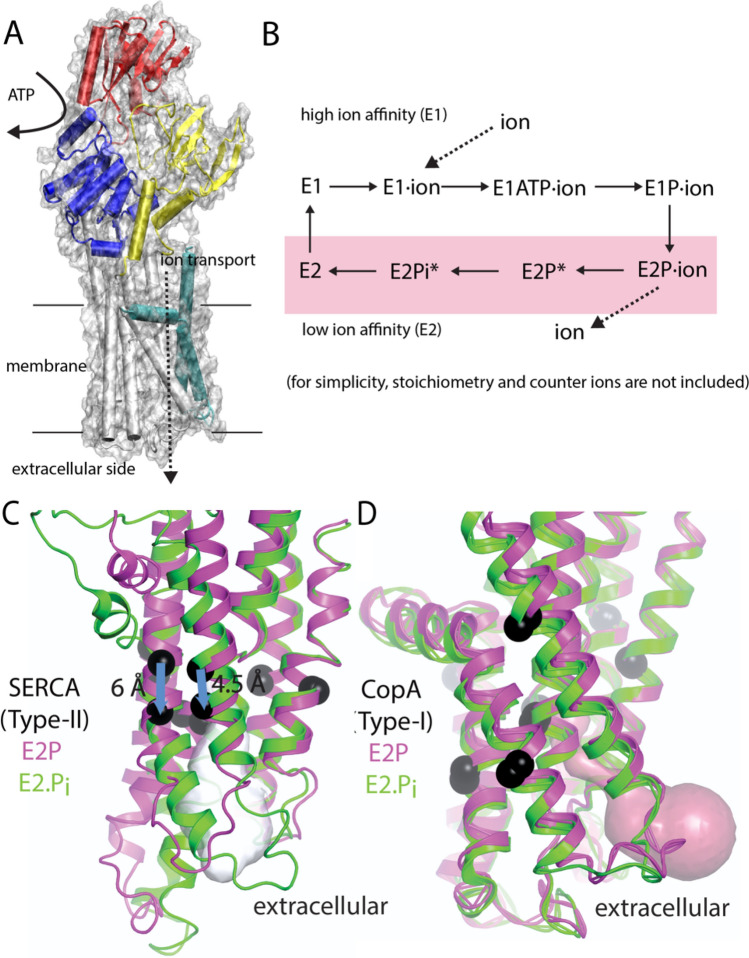
Fig. 2.
P-type ATPase structure, transport reaction, and subtype differences. (a) P-type ATPase architecture, exemplified by a bacterial Cu+-transporting ATPase (CopA), with nucleotide-binding (N), phosphorylation (P), and actuator (A) domains in red, blue, and yellow, respectively. The part of the membrane domain common to all P-type ATPases is shown in white and the CopA-specific helices in cyan. (b) P-type ATPase reaction scheme showing shifts in ion affinity (E1/E2) and accompanying phosphorylation events. Asterisks mark the existing Zn2+ and Cu+ ATPase crystal structures. A side-by-side comparison of the E2P (magenta)-to-E2Pi (green) transition of (c) SERCA and the (d) Cu+ ATPase highlights differences in structural dynamics in the transmembrane domain involved in ion release (black spheres correspond to similar Cα positions in each state). Adapted from Andersson et al. (2014)

