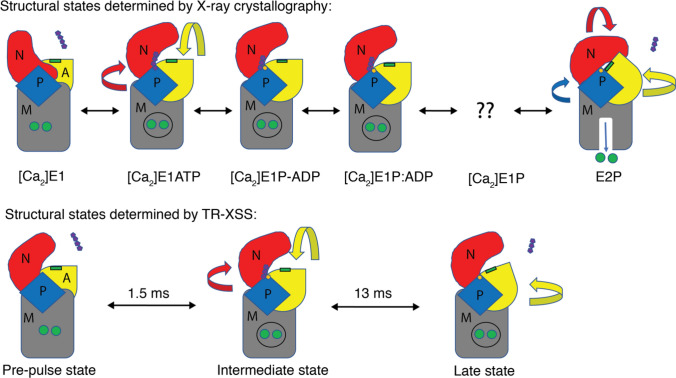
Fig. 6.
Schematic comparison of the principal structural rearrangements in-between crystal structures and TR-XSS models. The pre-pulse state shows reduced opening of the cytoplasmic domains, the intermediate TR-XSS model is similar to a [Ca2]E1ATP state, and displacement of the A domain in the late TR-XSS model exposes the ADP site, but with the N-domain not yet in a E2 position. The ATP and ADP displayed as four and three purple pentagons, the TGES motif is represented by a green rectangle, and phosphorylated aspartic acid in yellow, and the calcium ions are depicted as green circles. Adapted from Ravishankar et al. (2020)

