Figure 4.
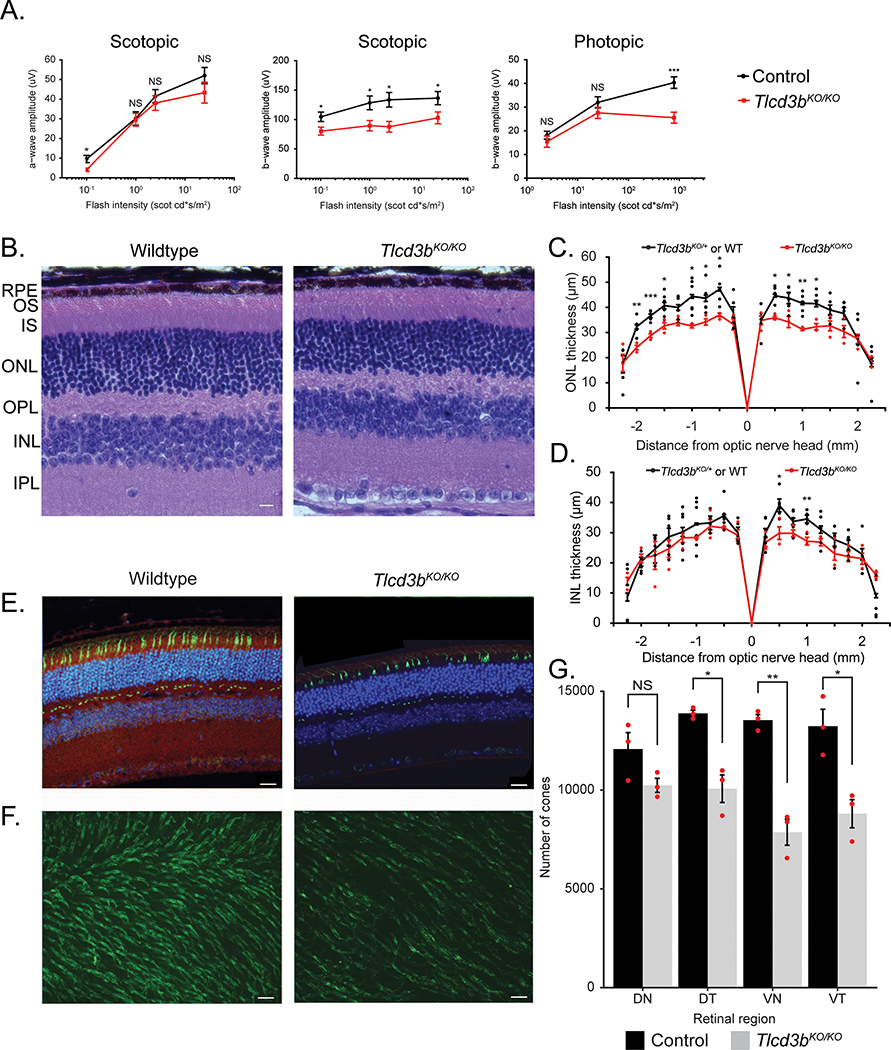
Tlcd3b knockout mice exhibit retinal degeneration and significant loss of cone photoreceptors. (A) Electroretinography analysis shows scotopic a-wave is unaffected (p = 0.3) but the scotopic b-wave (p = 0.01) and photopic b-wave (p = 0.008) amplitudes are reduced in 7-month-old Tlcd3bKO/KO mice (n=5) compared to Tlcd3b+/KO or wild-type control mice (n=7). (B) Hematoxylin and eosin staining of retinal cross-sections shows overall retinal thinning in Tlcd3bKO/KO mice compared to wildtype control mice at 7 months-of-age. Scale bar = 20 μm. RPE=retinal pigment epithelium, ONL=outer nuclear layer, INL=inner nuclear layer, OPL=outer plexiform layer, IPL=inner plexiform layer, GCL=ganglion cell layer, OS=outer segment, IS=inner segment. (C) ONL measurements show a 20% reduction (p = 0.003) in ONL thickness in Tlcd3bKO/KO mice (n = 3) compared to wildtype or Tlcd3d+/KO control mice (n = 6) at 7 months of age (p = 0.002). Each dot represents an individual data point plotted over mean ± SEM. (D) INL measurements show no significant changes (p = 0.1) in INL thickness in Tlcd3bKO/KO mice (n=3) compared to wildtype or Tlcd3b+/KO control mice (n=6) at 7 months of age. Each dot represents an individual data point plotted over mean ± SEM. (E) Co-staining of Fam57b preabsorbed antibody (red) and peanut agglutinin (PNA) (green) shows expression of Tlcd3b in cone photoreceptors. (E, F) PNA staining (green) shows loss of cones in Tlcd3bKO/KO retina compared to wildtype in retinal sections (E) and retinal wholemounts (F). Scale bar = (E) 20 μm, (F) 50 μm. (G) Cones were counted in the dorsonasal (DN), dorsotemporal (DT), ventronasal (VN), and ventrotemporal (VT) regions of (F) PNA-stained (green) retinal wholemounts of 7-month-old Tlcd3bKO/KO mice (n = 3) and control mice (n = 3). (F, G) The number of cones is significantly reduced in the Tlcd3bKO/KO retina compared to controls (p = 0.003). Data is expressed as average number of cones per mm2 (mean ± SEM). Individual data points were plotted in addition to statistics. NS = not significant, *p<0.05, **p<0.01, ***p<0.001.

