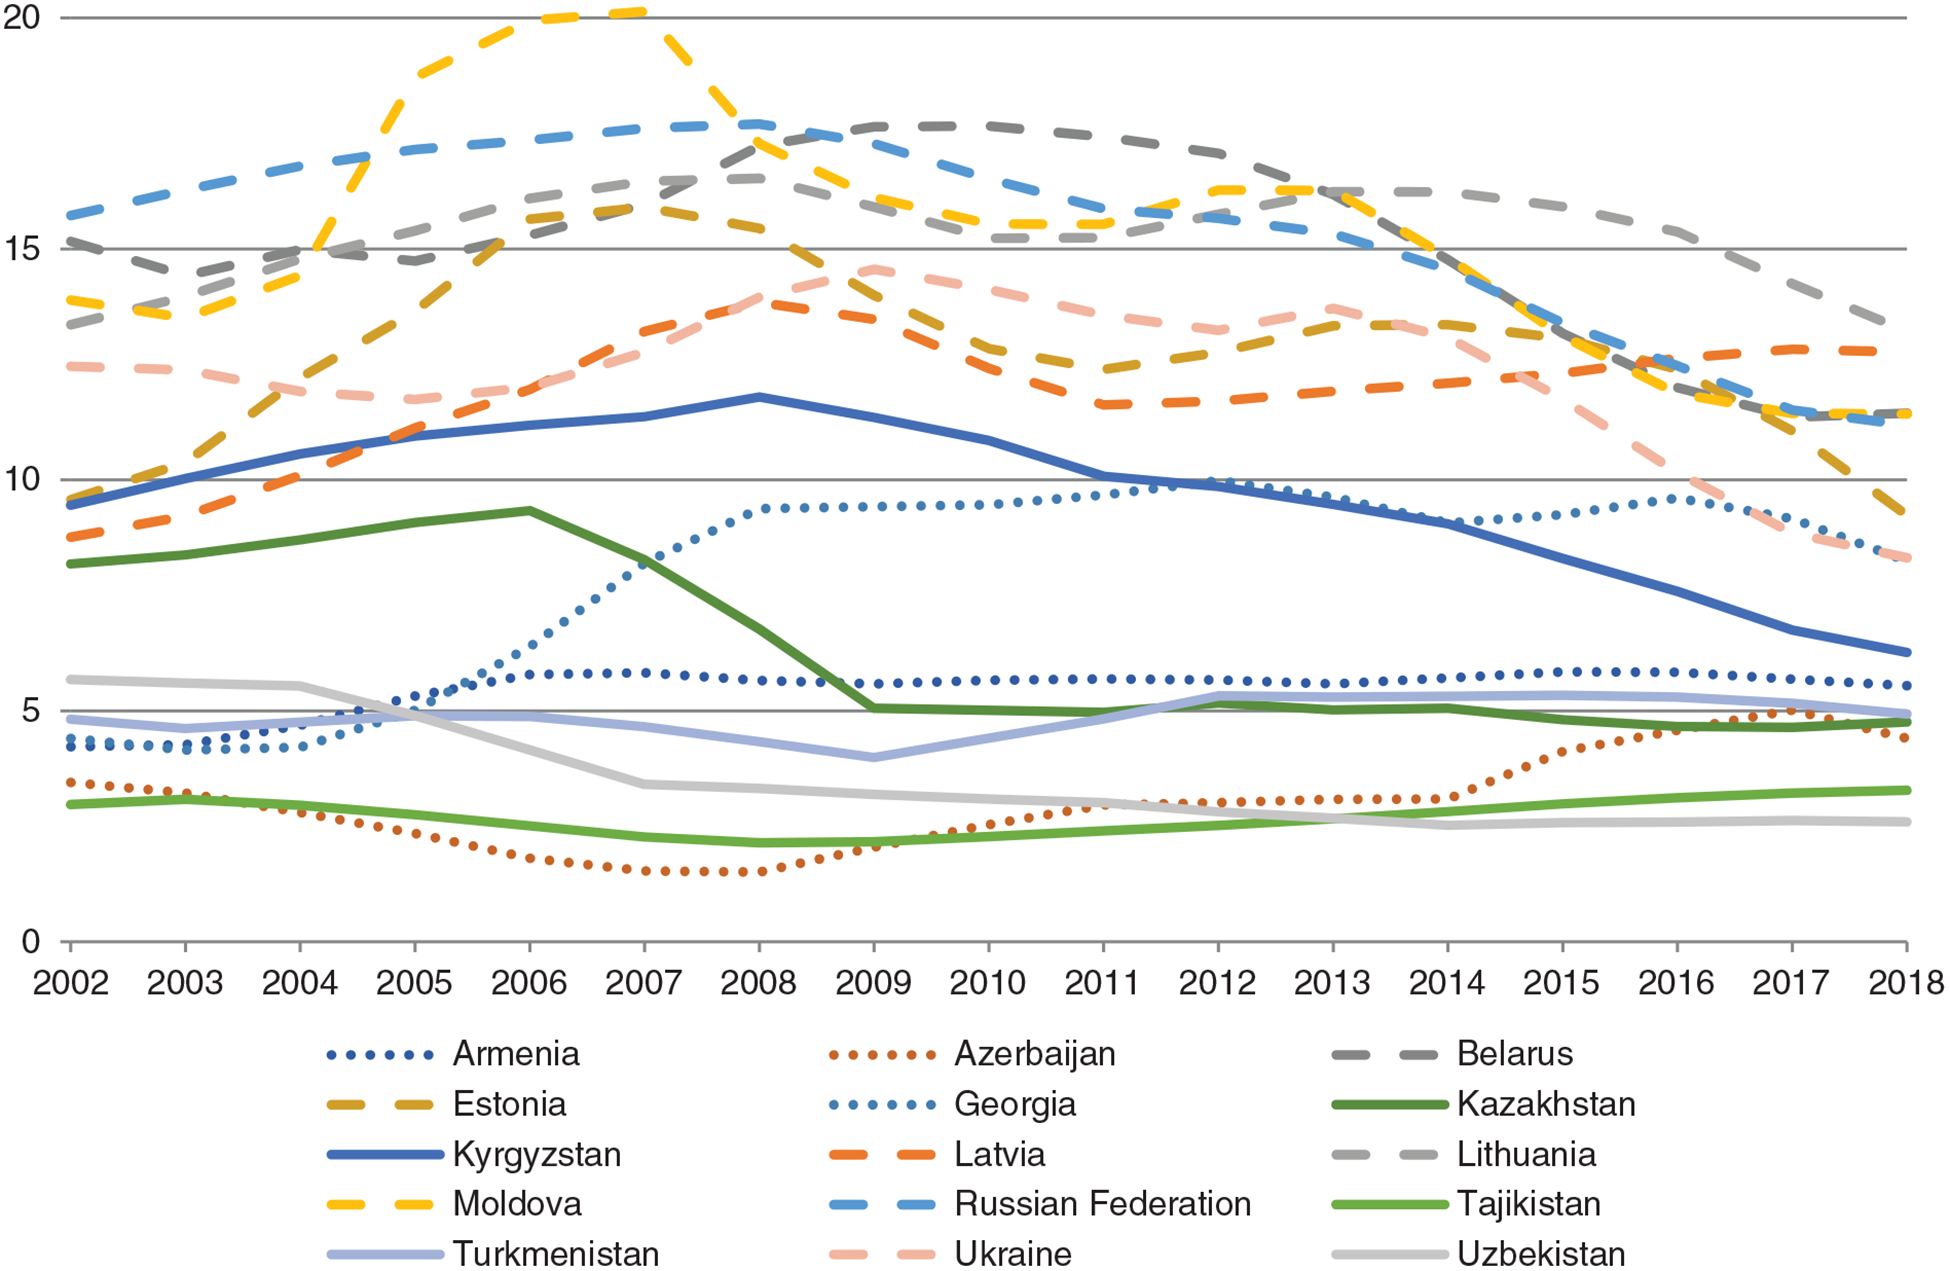
Figure 1.

Trends in total alcohol per capita consumption (15+) in litres of pure alcohol, 3-year moving averages. Total consumption includes recorded and unrecorded alcohol use and is adjusted for tourist consumption. Dashed lines: countries of Eastern Europe; dotted line: countries of Transcaucasia; full lines: countries of Central Asia. Source: WHO Global Survey on Alcohol and Health and the 2019 Global Survey on Progress on Sustainable Development Goal Health Target 3.5 [49].
