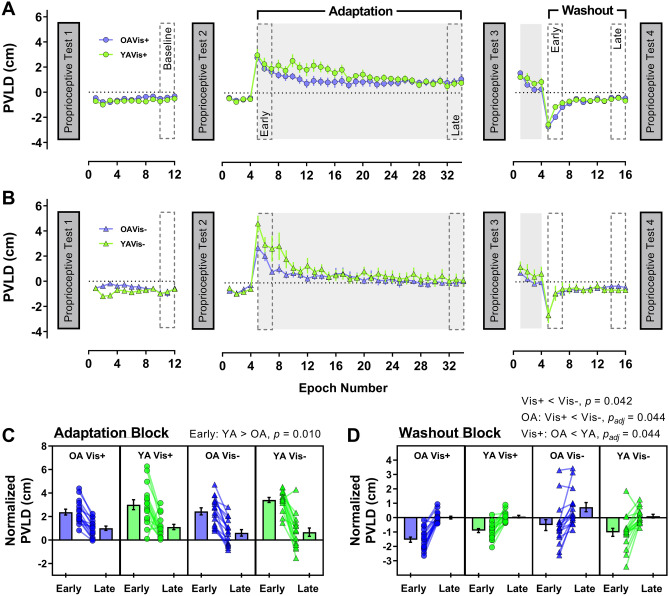
Fig. 2.
Group peak velocity lateral deviation (PVLD) data across the experiment for older (purple) and younger (green) adults in a Vision+ condition (circles) and b Vision− condition (triangles). For visualisation purposes only, epochs of 4 trials were created for each participant and then averaged within groups to generate the group means (± 1SE) shown in panels a and b, with grey shaded regions representing periods where the force-field was on. Lower panels show PVLD data (normalised to baseline) for the early and late portions of the adaptation block (c) and the washout block (d). In these panels, the means of individual participants are shown as symbols, with group averages (± 1SE) displayed in neighbouring bars. Significant post-hoc comparisons for group interactions also shown above respective panels

