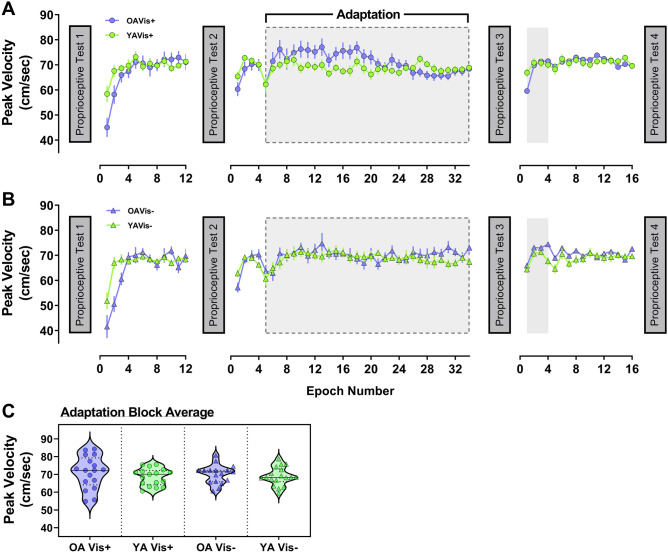
Fig. 4.
Peak velocity data shown across the experiment for older (purple) and younger (green) adults in the a Vision+ condition (circles) and b Vision− condition (triangles). For visualisation, epochs of 4 trials were created for each participant and then averaged within groups to generate data points above (± 1SE), with grey shaded regions representing periods where the force-field was on. c Violin plots of peak velocity averaged across the adaptation block when the force-field was switched on (indicated by grey dashed box outline in a and b) for all four sub-groups

