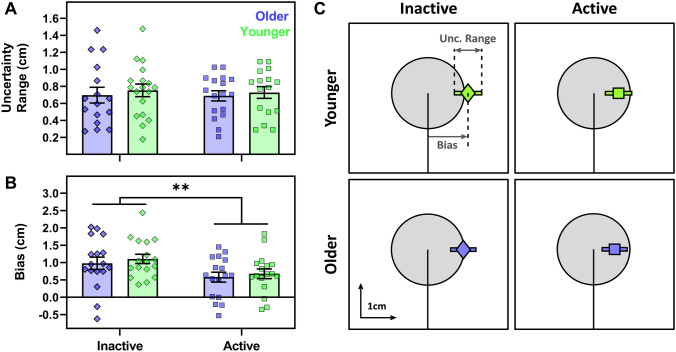
Fig. 5.
Baseline proprioceptive acuity for older (purple) and younger (green) participants grouped as physically active (squares) or inactive (diamonds). On the left-hand side, uncertainty range (a) and bias (b) are presented as group average bars (± 1SE) and individual participant symbols, where ** indicates effect of physical activity group (p < 0.01). c The group-averaged data from panels a and b, with mean bias (diamond or square) and mean uncertainty range (bar) superimposed over the target (grey circle), at the same scale for visualisation

