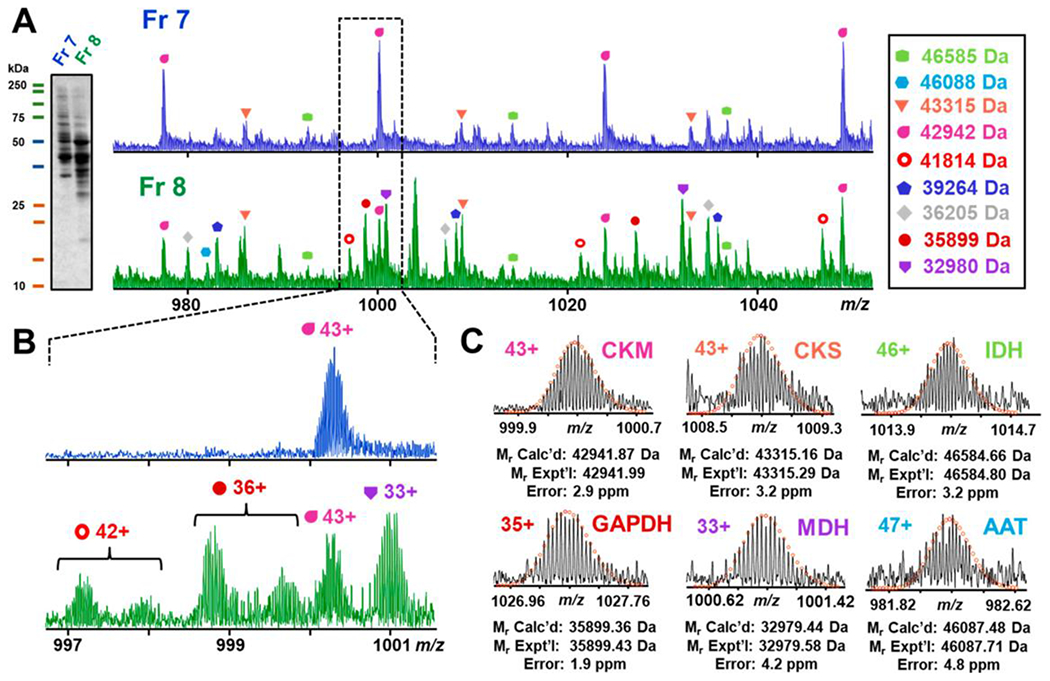
Figure 5|. sSEC fractionation and FT-ICR MS of metabolic enzymes from complex mixture of cytosolic proteins.

A) SDS-PAGE visualization of fractions 7 and 8 with corresponding FT-ICR mass spectra. B) Enlarged mass spectra of 997-1001 m/z for fractions 7 and 8 showing the difference between the mass spectra of the two fractions. C) Proteins detected by intact mass from top left to bottom right: creatine kinase, M-type (CKM); creatine kinase, S-type (CKS); isocitrate dehydrogenase (IDH); glyceraldehyde-3-phosphate dehydrogenase (GAPDH); malate dehydrogenase, mitochondrial (MDH); aspartate aminotransferase (AAT). Reprinted and adapted with permission from Tucholski, T., Knott, S., Chen, B., Pistono, P., Lin, Z., Ge, Y. Anal. Chem., 2019. 91, 3835-3844 (Tucholski et al., 2019). Copyright © 2019 American Chemical Society.
