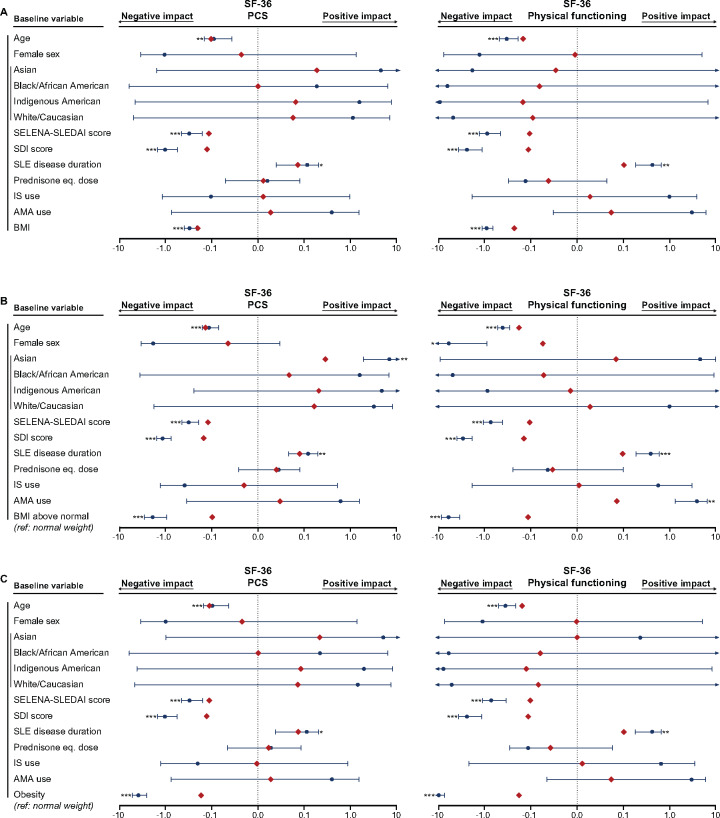
Fig. 2.
Associations of BMI with SF-36 PCS and PF
The forest plots illustrate results from multiple linear regression models. (A) BMI was analysed as a continuous variable. Separate models for the (B) BMI above normal and (C) obesity groups were created, with the normal weight group as the reference comparator in both cases. The dark blue circles represent the unstandardized coefficients and the whiskers represent the 95% CIs. The red diamonds represent the standardized coefficients. Asterisks indicate statistically significant associations. Level of significance: *P < 0.05, **P < 0.01, ***P < 0.001. AMA: antimalarial agents.

