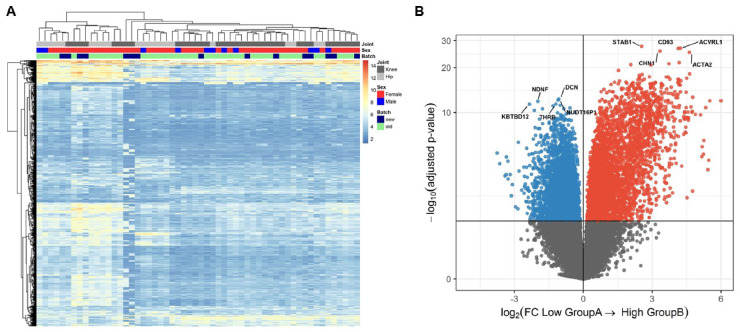
Fig. 2.
Unsupervised hierarchical clustering of the OA preserved cartilage and volcano plot
(A) Heatmap displaying subgroup A and B. (B) Volcano plot. Cluster B (n = 15) is presented as the effector and cluster A (n = 41) as reference. Blue circles represent genes lower expressed and red circles indicate genes higher expressed in subgroup B relative to subgroup A.

