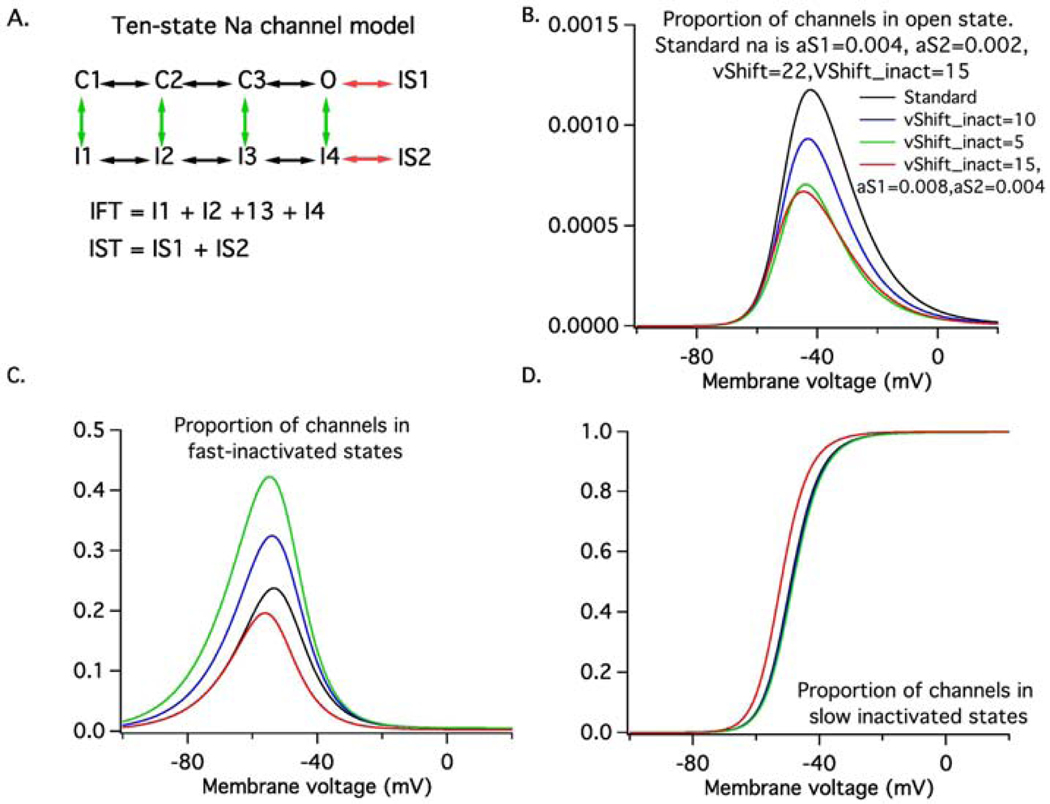
Figure 1. In Silico Motoneuron Model.
(A) Shows the ten-state model Na channel model. The green vertical arrows represent transitions to fast-inactivated states, whereas the red horizontal arrows represent transitions to slow-inactivated states. IFT represents the total occupancy of all fast-inactivated states whereas IST represents that of the slow-inactivated states. Shows the steady-state occupancy of the open (B), fast-activated (C) and slow-inactivated states (D) as a function of membrane voltage. The black lines represent the features of the standard model, the blue and green lines represent changes in fast-inactivation process produced by hyperpolarizing the fast-inactivation voltage-dependence by either 5 (blue) or 10 mV (green). The red lines represent changes in state occupancy produced by doubling the rate at which slow-inactivated states are entered. Note that the steady-state persistent Na current (open state occupancy) is nearly identical for the 10mV shift in fast-inactivation and for the faster entry into the slow-inactivated states. However, this state-state is reached at different rates in the two cases.

