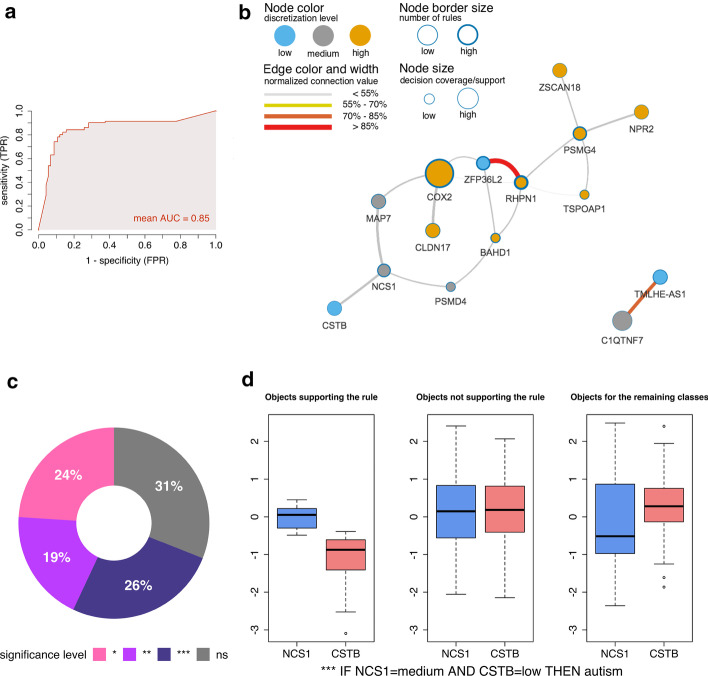
Fig. 3.
Rule-based model evaluation for the autism-control dataset performed with the Johnson reduction method. Discretization levels were obtained from the equal frequency method by categorizing the features into three bins. a ROC AUC for the model. Sensitivity that is as a true positive rate (TPR) and 1-specificity that is a false positive rate (FPR). b VisuNet network of co-predictive features for the autism class. Connection values represent the strength of node or edge. These values were estimated based on the rule support and accuracy. Rules were selected based on their statistical significance (Bonferroni-adjusted P ≤ 0.05). c Distribution of the significance of rules in the model. Bonferroni-adjusted P values were marked as ns(P > 0.05), *(P ≤ 0.05), **(P ≤ 0.01) and ***(P ≤ 0.001). d Distribution of support sets for the top-ranked rule from the recalculated model. Support sets represent sets of objects that fulfil the RHS of the rule (THEN-part). Boxplots display scaled gene expression values for objects supporting and non-supporting the given rule

