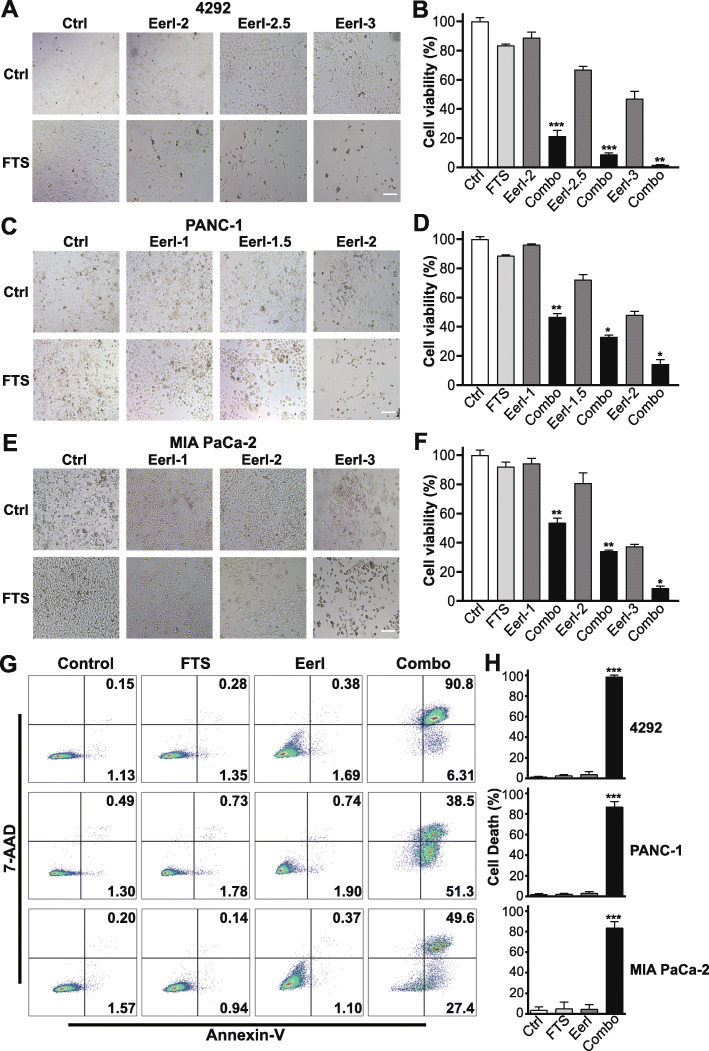
Fig. 2.
EerI synergizes with FTS to kill PDAC cells through apoptosis induction. a, c, e Bright field images (200X) of 4292, PANC-1, and MIA PaCa-2 cells treated with 100 μM FTS, EerI, or both for five days. EerI (μM) concentrations were indicated above each figure. Scale bar, 25 μm. b, d, f Relative cell viability following five days of treatment with FTS, EerI, or both. ANOVA with Tukey’s test compares the viability difference between combination and single treatments or controls. *P < 0.05, **P < 0.01, ***P < 0.001; data are presented as mean ± SD; n = 3). g Representative flow cytometric analysis of PDAC cell apoptosis following treatments with 100 μM FTS, EerI (3 μM for 4292, 2.5 μM for PANC-1 and MIA PaCa-2), or both for five days. Cells were stained with annexin-V and 7-AAD. Percentages of apoptotic cells were indicated in the quadrants. h PDAC cell death analysis following different treatments with Annexin V/7-AAD apoptosis assay. ANOVA with Tukey’s test compares difference treatment groups. ***P < 0.001; data presented as mean ± SD; n = 3.

