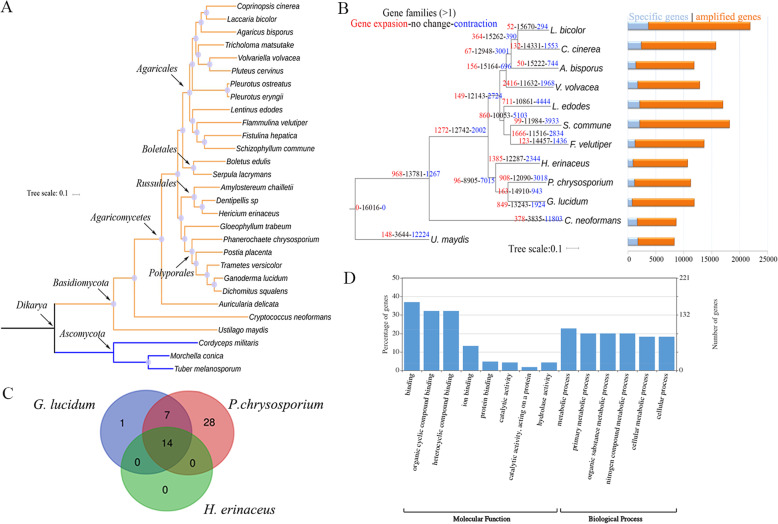
Fig. 3.
Comparative genomics analysis of H. erinaceus. a Phylogenomic analysis of H. erinaceus. The Maximum-likelihood tree was constructed based upon the concatenated sequences consisting of the single-copy orthologous sequences. b Analysis of changes in size and number of gene families in representative basidiomycetes. c Comparative analysis of GO annotation for gene families with big size. The number of gene families with big size in each species is > = 10, and three times more than those in other species. d WEGO analysis of the enriched genes (> = 10) of H. erinaceus

