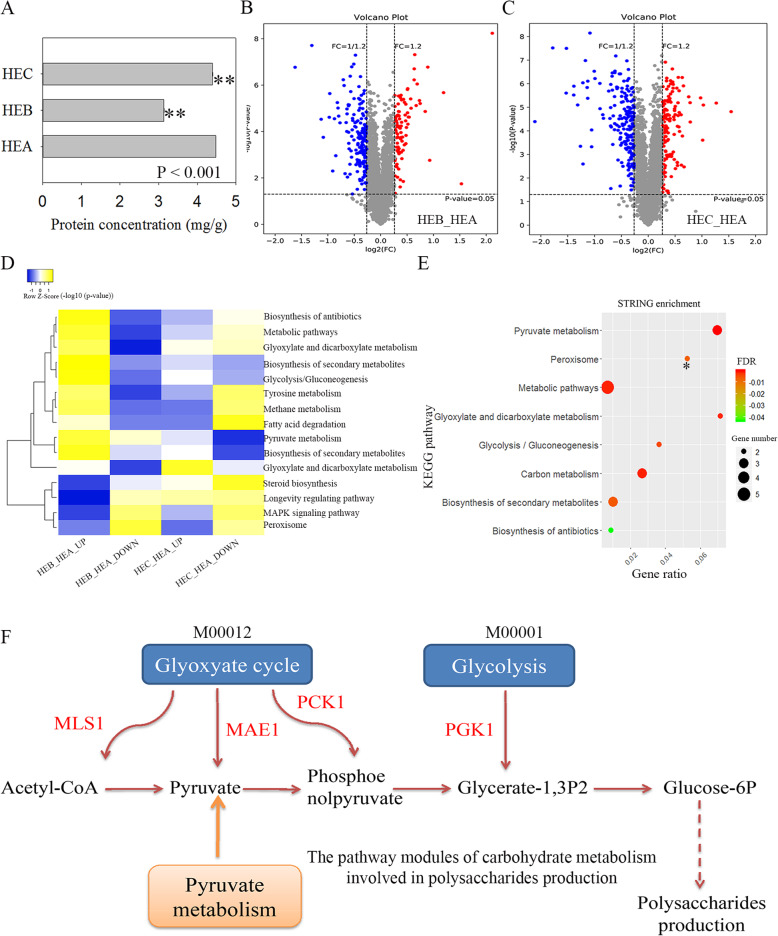
Fig. 5.
Comparative proteomics analysis of H. erinaceus. a Protein concentration determination using the BCA method. b Volcano plot analysis of DEPs of HEB_vs_HEA. c Volcano plot analysis of DEPs in HEC_vs_HEA. d The co-enriched KEGG pathways in HEB_vs_HEA and HEC_vs_HEA. The co-enriched KEGG pathways were obtained from the Venn analysis of enriched KEGG pathways in HEB_vs_HEA and HEC_vs_HEA in Additional files 10, 11, 12 and 13. The DEPs were used for KEGG pathway enrichment. Yellow indicates strong enrichment, and blue indicates weak enrichment. e STRING network analysis of enriched and differentially co-expressed proteins. These proteins were obtained from the Venn analysis of the DEPs in the enriched pathways in HEB_vs_HEA and HEC_vs_HEA. These circles represent the enrichment results using the co-upregulated proteins, and * represents the enrichment results using the co-downregulated proteins. f The pathway modules of carbohydrate metabolism leading to the production of glucose-6P. Red represents the apparent upregulation of MAE1(A6232), MLS1(A4695), PCK1(A5260) in the glyoxylate cycle modules (M00012), and PGK1 (A8906) in the glycolysis module (M00001)

