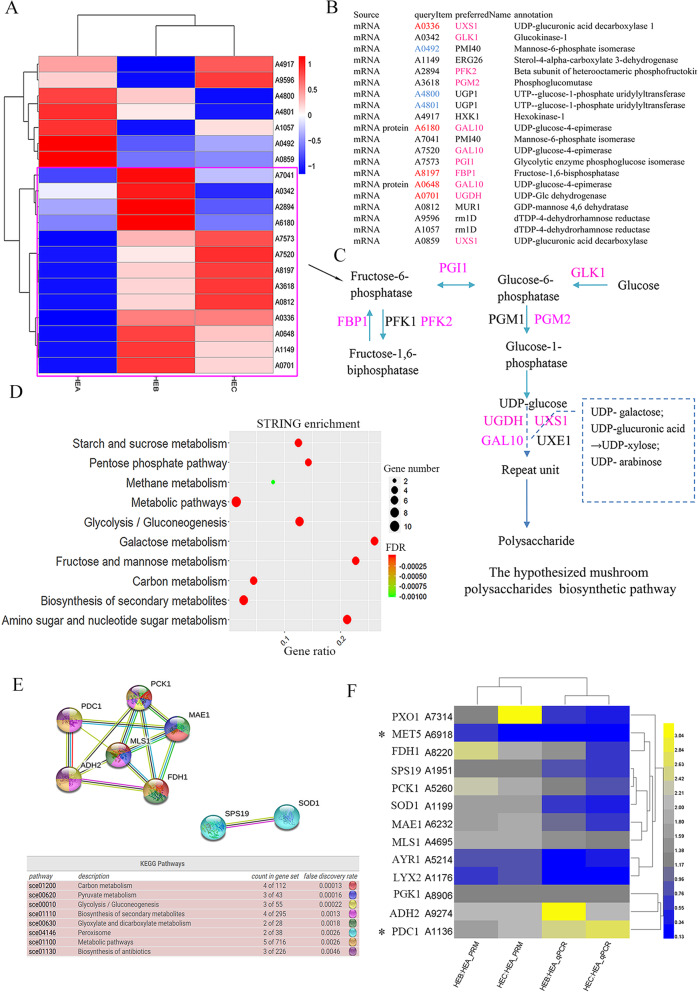
Fig. 6.
Multi-omics analysis of the MPBP in H. erinaceus. a Heatmap analysis of expressed mRNA involved in MPBP. The cluster with upregulation in HEB or HEC was marked by purple rectangular. Red represents high expression. Blue represents low expression. b The list of DEGs involved in MPBP. Red represents an obvious upregulation; Blue represents an obvious down-regulation. The DEGs were obtained from the transcriptome and proteomics data, respectively. c The MPBP modified from reference [14]. Purple represents the upregulated genes in HEB or HEC in the purple rectangular of Fig. 6a. d STRING enrichment of the expressed mRNA involved in MPBP. e STRING network analysis of the CDC genes. The CDC genes were obtained by the Venn analysis of the co-enriched DEGs using DAVID and STRING enrichment in HEB_vs_HEA and HEC_vs_HEA in Additional file 15. f Heatmap clustering of the expression value of the CDC genes using qPCR and PRM. Yellow indicates high expression, and blue indicates low expression. *Represents the genes with the statistical support by qPCR (P < 0.05) and PRM (P < 0.05)

