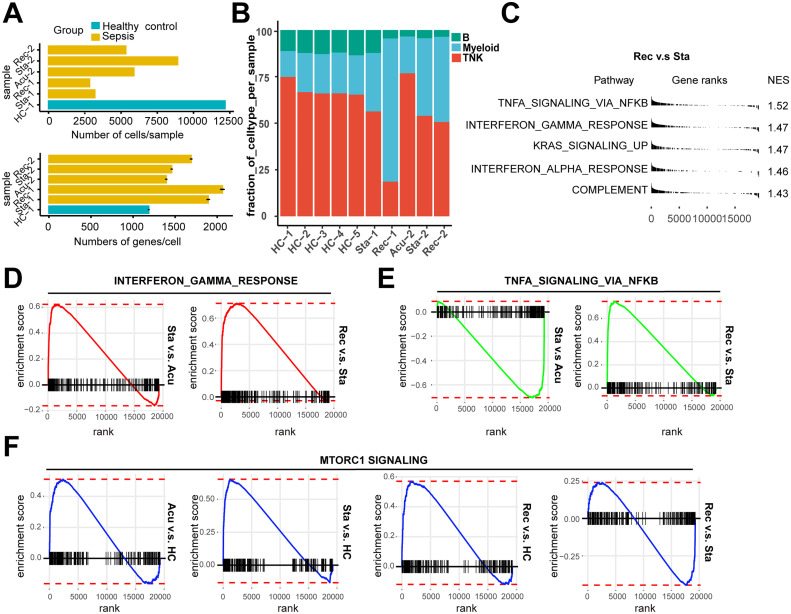
Fig. S1.
Pathway enrichment analysis in all PBMCs and cell subpopulations
A. The number of cells per sample (upper panel) and mean genes per cells (lower panel) that passed quality control. The error bar indicated mean with standard error. B. Histogram showed the proportion of the major cell types in each healthy controls (HCs) and patient sample. C. Pathway enrichment analysis of significant hallmark gene sets comparing PBMCs from recovery stage with those from stable stage. NES, normalized enrichment score. D. GSEA enrichment plots of interferon gamma response of T/NK cells (stable stage v.s acute stage; recovery stage v.s stable stage). E. GSEA enrichment plots of TNFA signaling via NFκB of myeloid cells (stable stage v.s acute stage; recovery stage v.s stable stage). F. GSEA enrichment plots of MTORC1 signaling of B cells in each disease stage versus HCs, recovery stage versus stable stage.

