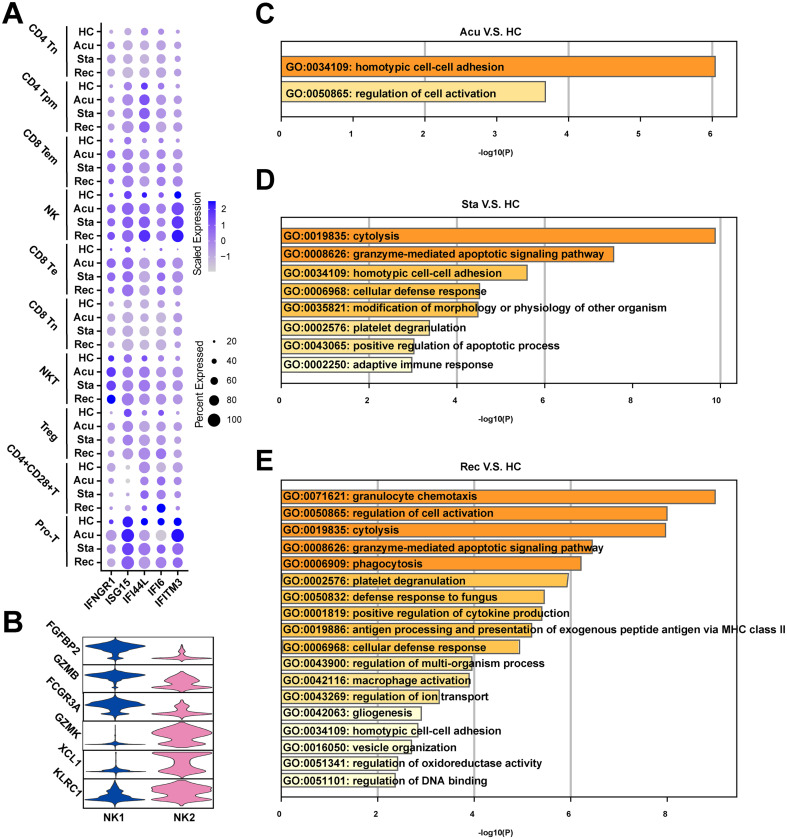
Fig. S2.
Functional features of T/NK cells that upregulated in patients with sepsis secondary to bacterial pneumonia
A. Dot plots showed the expression level and percentage of interferon gamma response genes of T/NK cells in healthy controls (HCs) and disease stages. The colour key from gray to purple indicates low to high expression levels. The dot size indicated the percentage of cells that expressed genes. B. Violin plots showed the scaled expression levels of canonically cell marker genes used to identify each NK cell types. Upregulated GO terms in disease stages (C. acute stage, D. stable stage, E. recovery stage) versus healthy controls of T/NK cells. GO terms were labeled with name and ID, and sorted by -log10(P) value.

