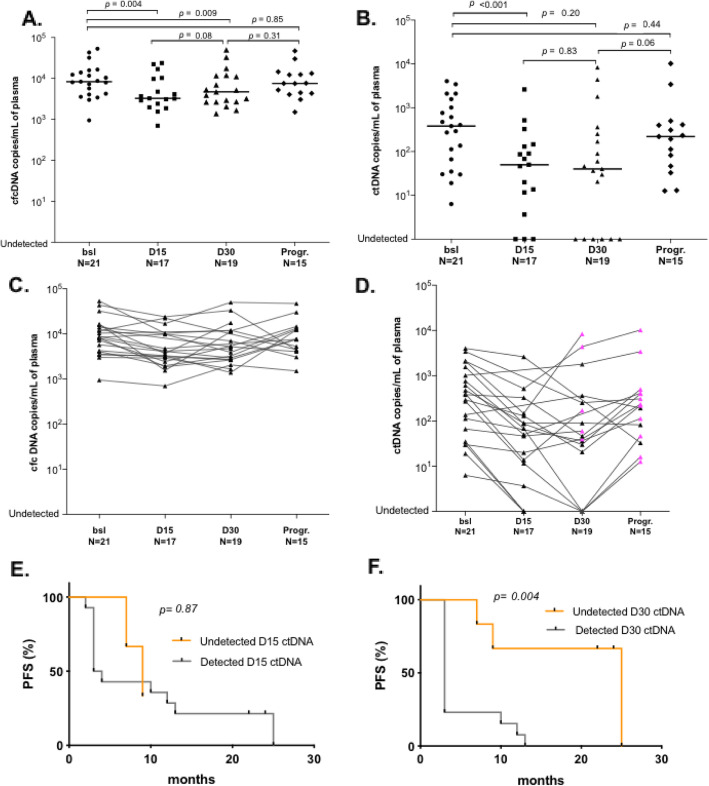
Fig. 3.
Early ctDNA dynamics during palbociclib-fulvestrant treatment and impact on survival. cfcDNA (a) or ctDNA (b) quantifications in copies per ml of plasma at 4 different time points during therapy. Black lines refer to median values. cfcDNA (c) or ctDNA (d) variations along 4 sampling time points during therapy. Pink triangles highlight samples with increased ctDNA level compared to the previous assessable time point. Wilcoxon tests were used to compare DNA levels. Bsl, baseline; D15, day 15; D30, day 30; Progr., disease progression. Progression free survival of patients split by ctDNA detected or not, at day 15 (e) and day 30 (f)

