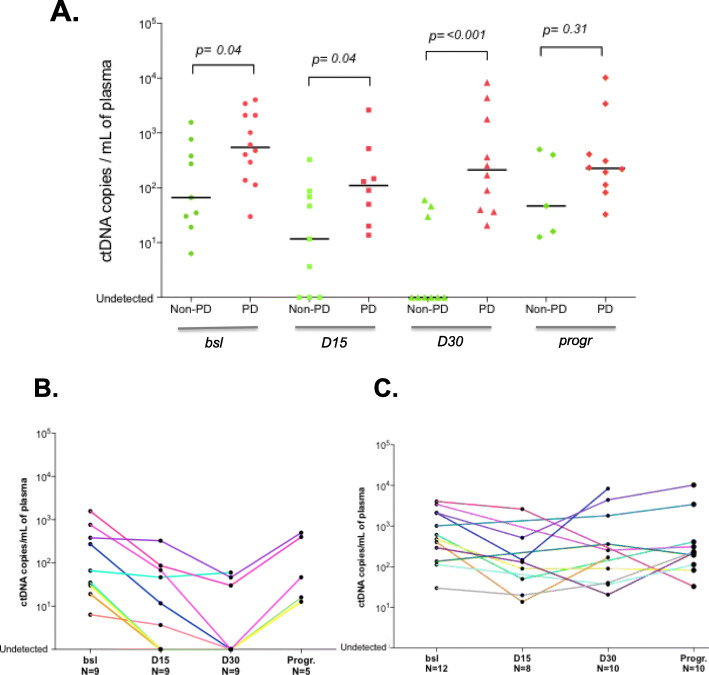
Fig. 4.
ctDNA dynamics correlation with treatment response. a ctDNA concentrations at the 4 sampling time points in patients with non-progressive disease (green) versus patients with progressive disease (red) after 3 months of palbociclib-fulvestrant. Black lines refer to median values. ctDNA variation in patients with non-progressive disease (b) or progressive disease (c) during treatment follow-up. Each patient is highlighted with a unique color. Bsl, baseline; D15, day 15; D30, day 30; Progr., disease progression; PD, progressive disease

