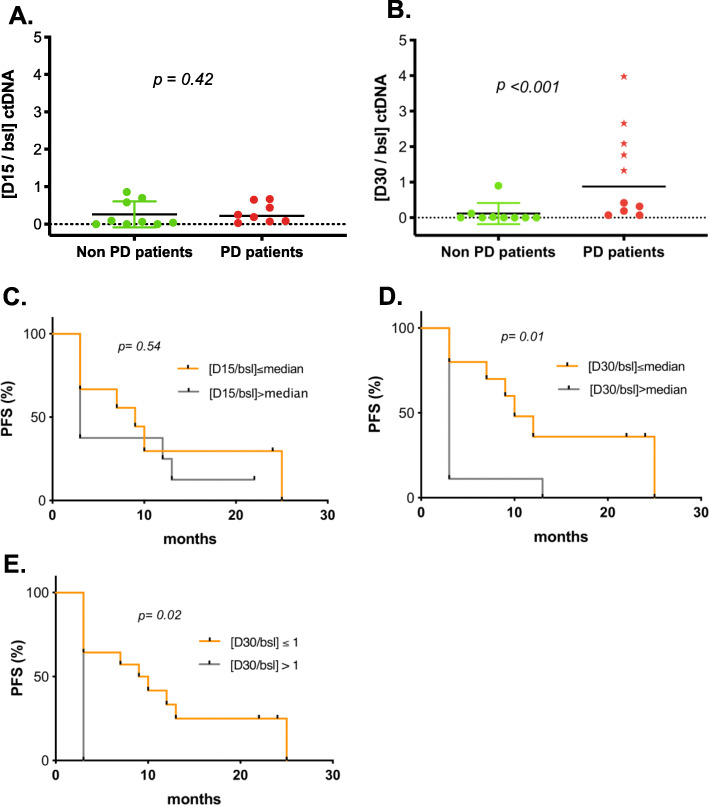
Fig. 5.
ctDNA ratios, treatment response, and impact on survival. ctDNA ratios for patients with non-progressive disease (green) vs progressive disease (red) after 15 days (a) or 30 days (b) of treatment. P values were calculated using Mann–Whitney tests. Median is highlighted by a solid black line. Patients highlighted with a star display increased ctDNA levels, which predict progression at 3 months. c–e Progression free survival of patients under palbociclib-fulvestrant therapy split by median ctDNA ratio at D15 (c, median D15 = 0.16), median ctDNA ratio at D30 (d, median D30 = 0.09), ctDNA ratio > 1 or ≤ 1 at D30 (e)

