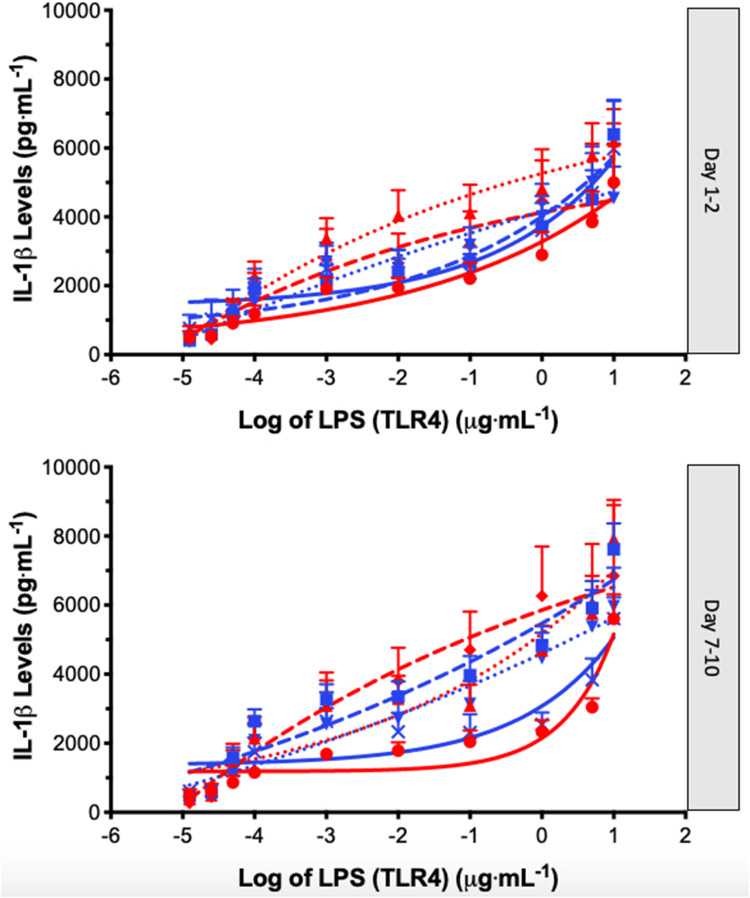
Figure 2.
IL-1β release (Mean ± SEM) following LPS (TLR4) stimulation (12.5pg·mL to 10µg·mL) of PBMC’s obtained from controls: no OC (red circle, solid line), controls: OC (blue square, solid line), dysmenorrhea: no OC (red triangle, dotted line), dysmenorrhea: OC (blue upside down triangle, dotted line), pelvic pain: no OC (red diamond, dashed line), and pelvic pain: OC (blue cross, dashed line). A four-parameter logistic dose–response curve has been fitted to each graph; data obtained from Days 1–2 and Days 7–10 of each individual’s menstrual cycle.

