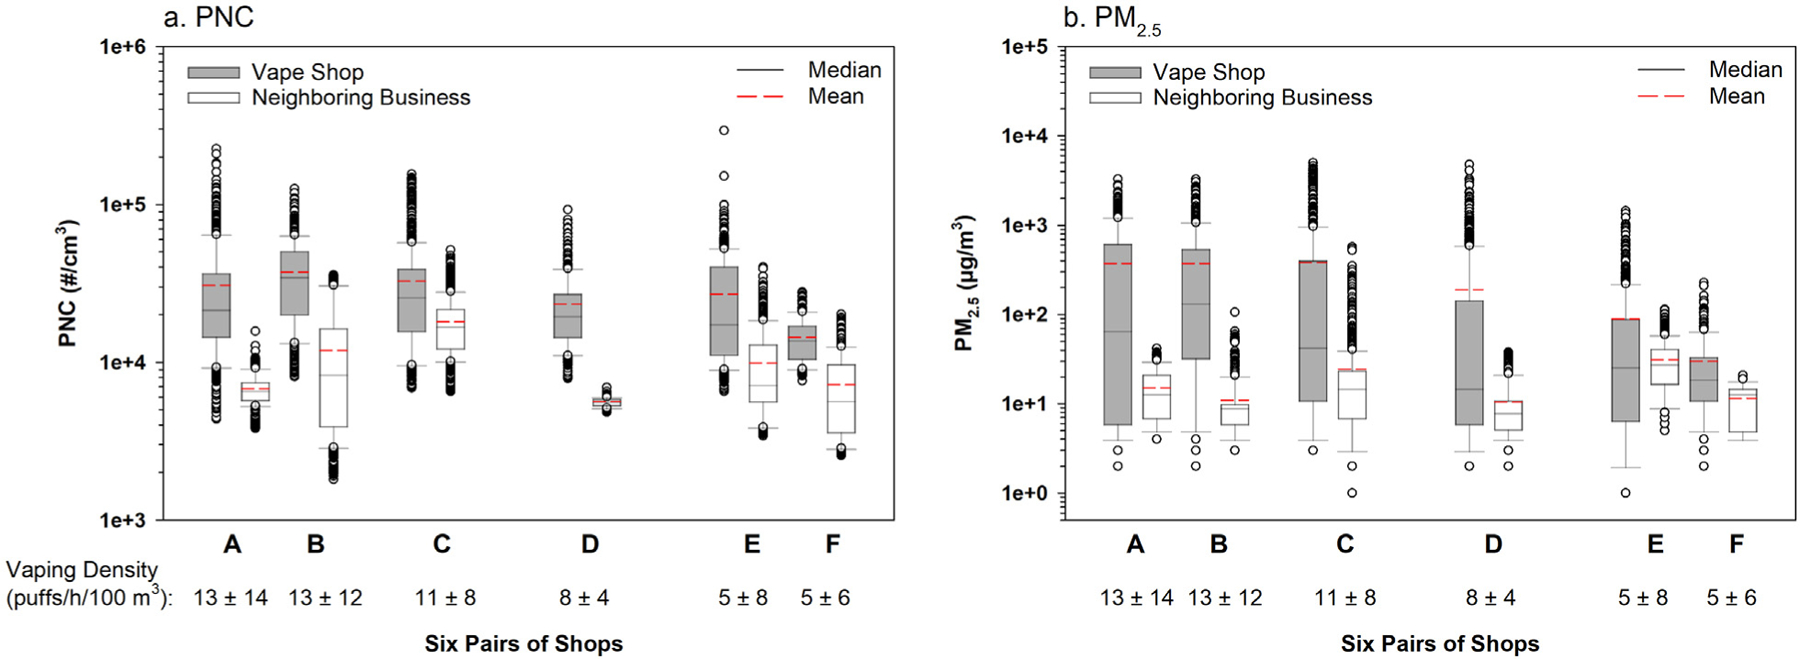
Fig. 2.

Box plots summarizing (a) PNC and (b) PM2.5 mass concentrations measured during all sampling sessions for the six pairs of vape shops and neighboring businesses A–F by vaping density. The solid line in each box represents the median value, and the dash line in each box represents the mean value.
