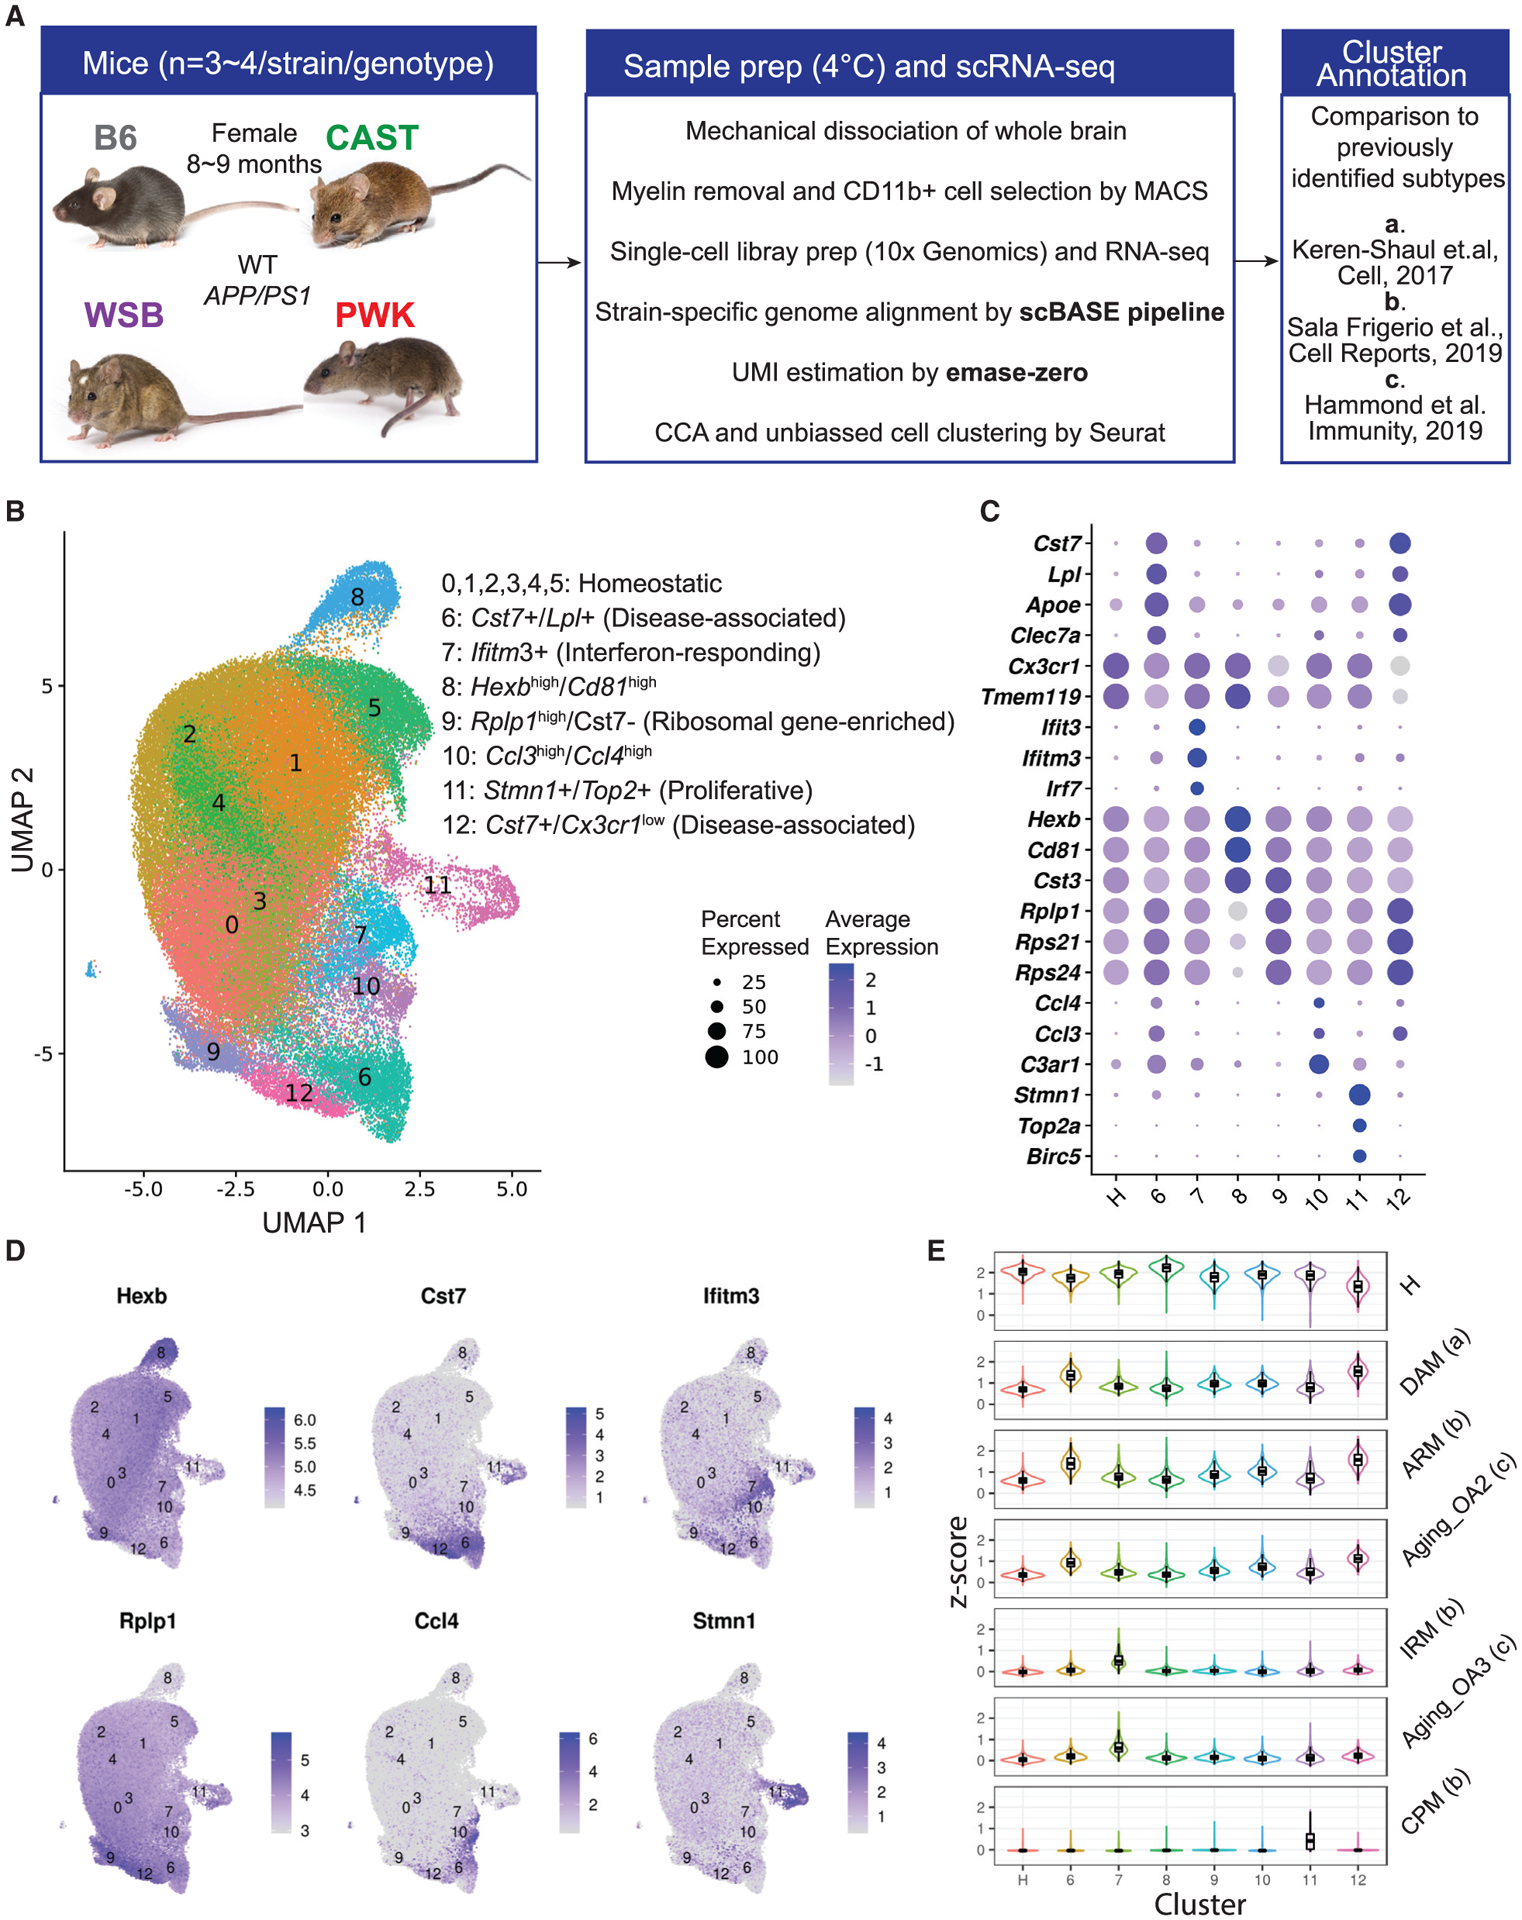
Figure 1. Clustering and annotation of microglia subtypes in B6 and wild-derived mice.

(A) Overview of the experimental strategy.
(B) UMAP plot showed 87,746 strain-integrated microglia from all 29 mice (20,732 from B6, 24,124 from CAST, 19,702 from PWK, and 23,188 from WSB), reflecting diverse microglia subtypes including homeostatic (clusters 0–5), disease-associated (clusters 6 and 12), interferon-responding (cluster 7), Hexbhigh/Cd81high (cluster 8), ribosomal gene-enriched (cluster 9), Ccl3high/Ccl4high (cluster 10), and proliferative microglia (cluster 11).
(C) Dot plot showing the classical marker genes for microglia subtypes with their percentage expressed (dot size) and average expression (color intensity).
(D) UMAP plots highlighting microglia subtype marker genes including Hexb, Cst7, Ifitm3, Rplp1, Ccl4, and Stmn1.
(E) Violin boxplots showing the enrichment Z score for each cluster (all strains combined) based on marker genes from previously identified microglia subtypes. Microglia subtypes from previous studies for comparison include homeostatic microglia (Keren-Shaul et al., 2017; Sala Frigerio et al., 2019; Hammond et al., 2019; Gosselin et al., 2017; Butovsky and Weiner, 2018), disease-associated microglia (DAM) (Keren-Shaul et al., 2017), activated-response microglia (ARM) (Sala Frigerio et al., 2019), interferon-responding microglia (IRM) (Sala Frigerio et al., 2019), aging-associated microglia (OA2, OA3) (Hammond et al., 2019), and cycling and proliferative microglia (CPM) (Sala Frigerio et al., 2019). Significant variation in enrichment score was detected across the clusters (p < 2 × 10⁻¹⁶, one-way ANOVA), which supported identification of clusters 6 and 12 as DAM/ARM and cluster 7 as IRM.
