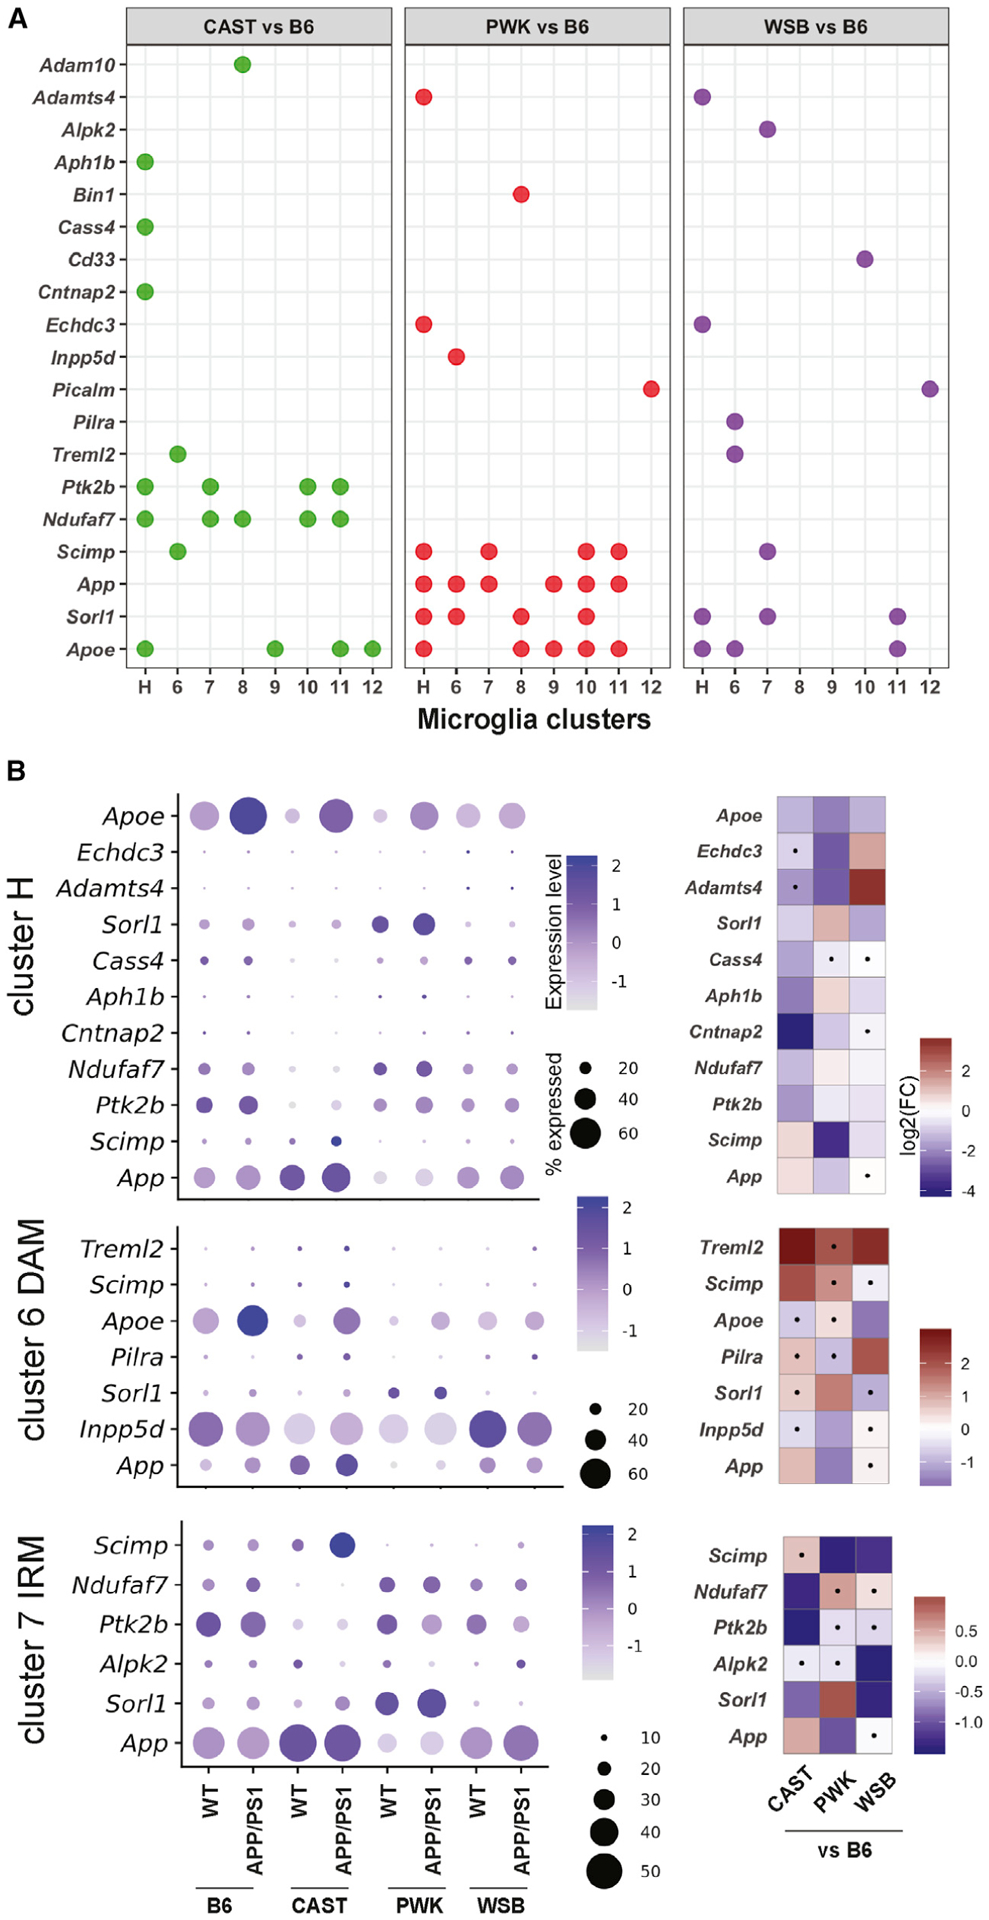
Figure 7. Microglia subtypes from wild-derived strains show differentially expressed AD-relevant GWAS genes.

(A) Nineteen AD-relevant GWAS genes were DE comparing wild-derived strains to B6 for all eight microglia clusters. The dot indicates the gene was significantly DE (FDR < 0.05) comparing CAST, PWK, or WSB to B6 in a given cluster.
(B) Dot plot (left) showing the percentage of cells expressed and the expression levels of significant strain-specific DE genes in homeostatic microglia (cluster H), DAM (cluster 6), and IRM (cluster 7) across all groups. Heatmap (right) highlighting the log2-based fold change (log2FC) of the corresponding gene expression comparing CAST, PWK, and WSB to B6 in clusters H, 6, and 7. The dot in the heatmap indicates the fold change for a given comparison was not significant (FDR ≥ 0.05).
