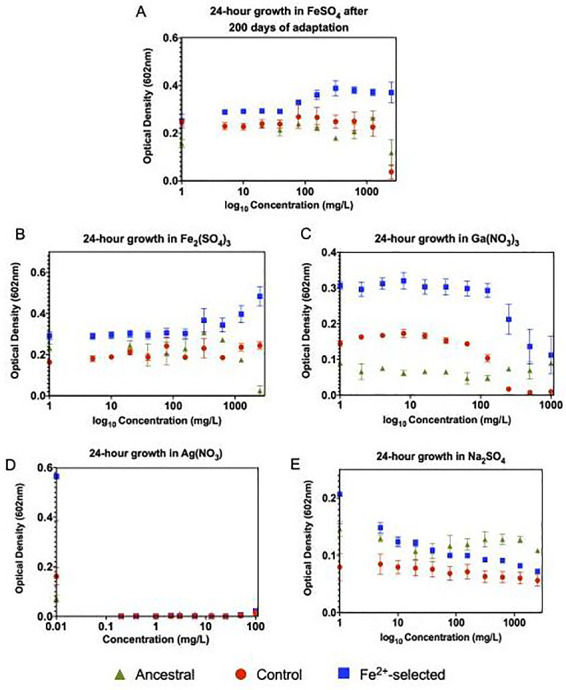
Figure 1.

Twenty-four hours growth assay to assess the progression and overall timeframe of iron adaptation. All five individual control populations (C1–C5), all five individual iron adapted populations (Fe2+_1-Fe2+_5) and four replicates of the ancestral population were grown for 24-h in increasing concentrations of FeSO4 in triplicate. Optical densities were then measured at 602 nm. The mean of the controls (red), ancestral (green) and adapted (blue) populations were then plotted, error bars represent standard error among the populations. (A) After 200-days of adaptation, the control populations showed almost complete inhibition at 2500 mg/l. The iron (II)-selected populations display increasing optical densities at low concentration and steady growth at higher concentrations, all of which are significantly higher than what was exhibited by the controls and the ancestral population. This data giving strong evidence for the successful adaptation to optimized growth in iron (II) after 200-day of selection. (B) 24-h growth in Fe2(SO4)3, (C) 24-h growth in Ga(NO3)3, (D) 24-h growth in AgNO3 and (E) 24-h growth in Na2SO4. All iron (II)-adapted populations showed increased resistance to all four of the metals tested. Albeit, the overall growth rate increase was most apparent in iron (III) and the iron-analog gallium (III). Optical densities were severely hindered in both silver and sulfate with the iron (II)-adapted populations slightly outperforming the controls. This data demonstrates the pleiotropic effects associated with iron (II) adaptation which leads to general metal resistance. For statistical analysis, ANOVA analysis using a generalized linear model was performed to evaluate the treatment effect associated with selection in FeSO4. Both the F-statistic and P-values are reported in Table 1
