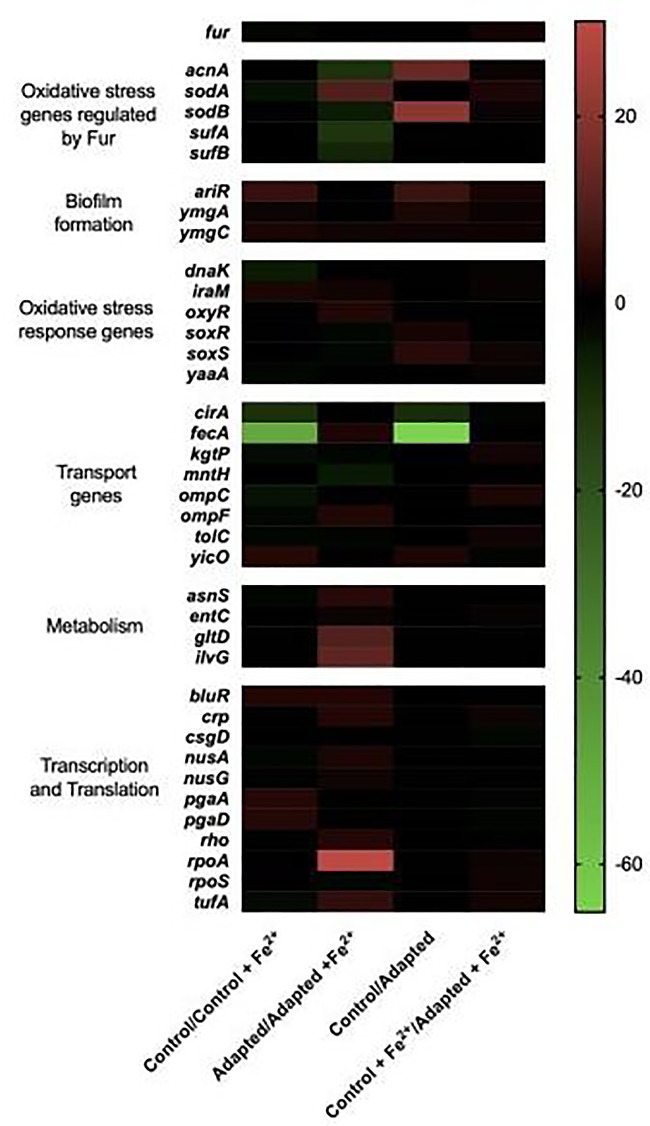
Figure 3.

Differential gene expression in response to FeSO4 acclimation. Gene expression studies were conducted at day 200 using NanoString technologies of 48 genes selected for their acquisition of mutations during the selection regime or for their role in general iron metabolism. Here, fold changes in RNA counts between each averaged set of populations for 38 of the 50 selected genes are reported (the remainder can be seen in Supplementary Table S2). For analysis, all genes that had a calculated P-value > 0.05 for their fold change were deemed zero. Each averaged population [controls or iron (II) adapted] were analyzed in pairwise combinations for fold-changes and represented in the heat map. Most notably, the adapted populations’ downregulate genes involved in iron transport and increase expression of oxidative stress response genes even in absence of exposure to iron. Normalized NanoString gene expression data was analyzed in terms of ratios and then converted into log2 ratios, (fold-changes). For statistical analysis, a t-test was performed on log2-transformed count data for each pairwise comparison and reported in Supplementary Table S2
