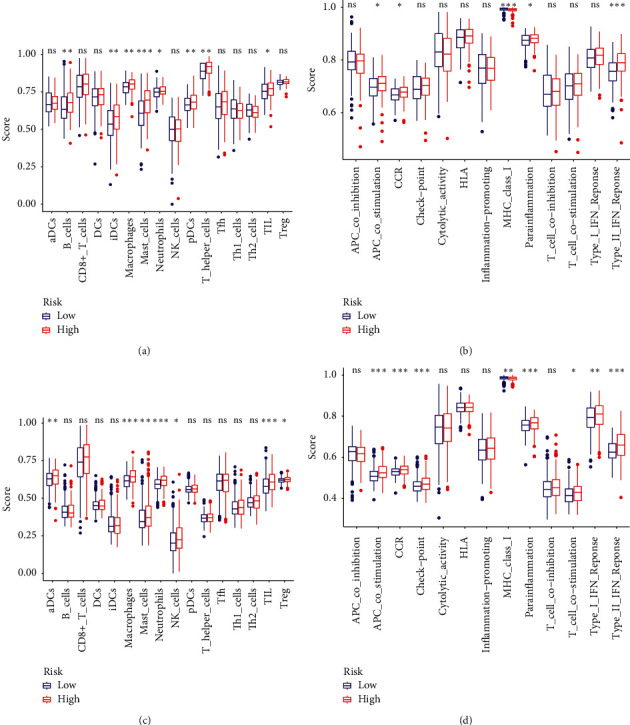
Figure 8.

Differences of immune cells infiltration and immune-related pathways between risk groups. ssGSEA scores of 16 immune cells (a) and 13 immune-related functions (b) in the TCGA cohort. ssGSEA scores of 16 immune cells (c) and 13 immune-related functions (d) in the meta-GEO cohort. ns: not significant; ∗P < 0.05; ∗∗P < 0.01; ∗∗∗P < 0.001; ∗∗∗∗P < 0.0001.
