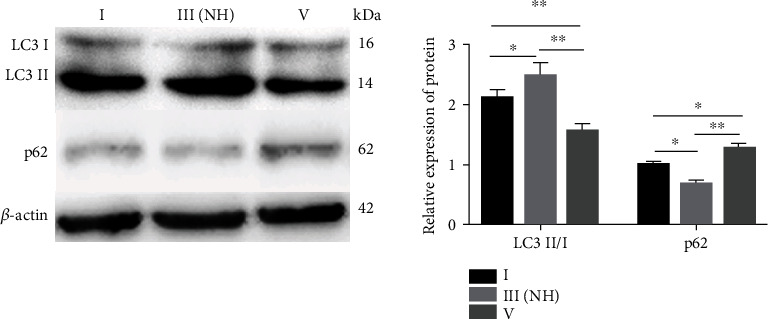
Figure 2.

Western blot analysis of LC3II/I and p62 expression in NP cells from the grade I, III(NH), and V groups. The relative protein expression of LC3II/I corresponds to the ratio of LC3II signal to LC3I signal, and p62 corresponds to the ratio of p62 signal to β-actin signal. The values are shown as the mean ± standard deviation (S.D.) of three independent experiments performed in triplicate. ∗P < 0.05, ∗∗P < 0.01. NH: normal height.
