
Figure 3.
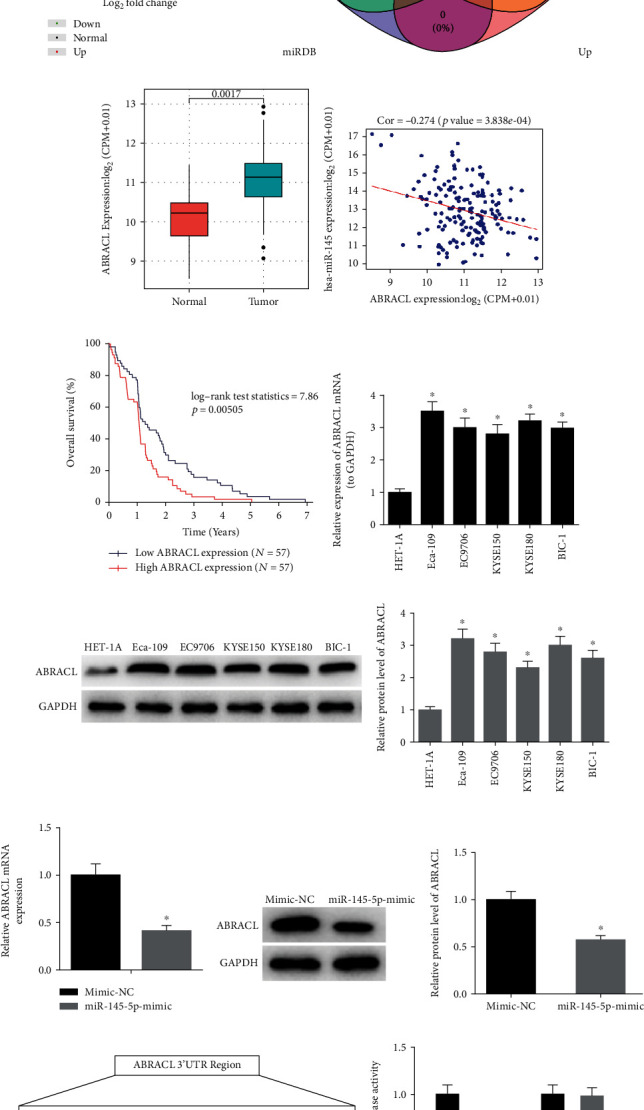
ABRACL is a direct target of miR-145-5p. (a) Volcano plot shows the DEmRNAs in TCGA-ESCA dataset. (b) Venn diagram shows the overlapping mRNAs between the predicted targets of miR-145-5p and the upregulated DEmRNAs in TCGA-ESCA dataset. (c) Relative expression of ABRACL in the samples obtained from TCGA-ESCA dataset. (d) The correlation between miR-145-5p and ABRACL. (e) The survival analysis for ABRACL in TCGA-ESCA dataset (each vertical node represents a death of a follow-up individual), (f, g) qRT-PCR and Western blot show the relative mRNA and protein levels of ABRACL in EC cell lines Eca-109, EC9706, KYSE150, KYSE180, and BIC-1 and in normal esophageal cell line HET-1A. (h, i) The relative mRNA and protein expression of ABRACL in mimic NC and miR-145-5p mimic groups. (j) Putative binding sites of miR-145-5p on ABRACL 3′-UTR along with corresponding mutation sites and relative luciferase activity in each treatment group. ∗ indicates p < 0.05.