Figure 1.

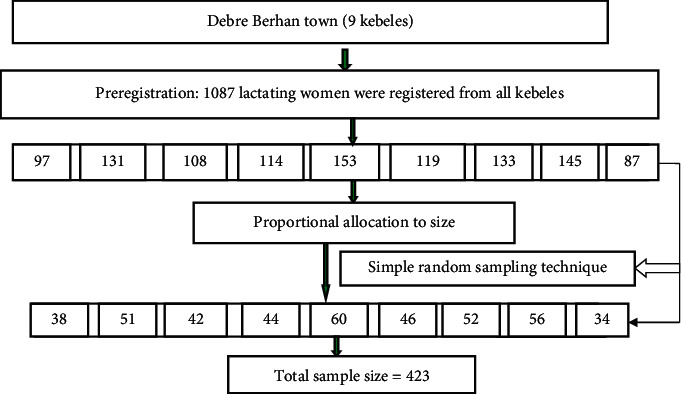
Schematic representation of sampling techniques for studied lactating women (n = 423) in the case of central Amhara, Ethiopia, from March to June 2016.

Schematic representation of sampling techniques for studied lactating women (n = 423) in the case of central Amhara, Ethiopia, from March to June 2016.