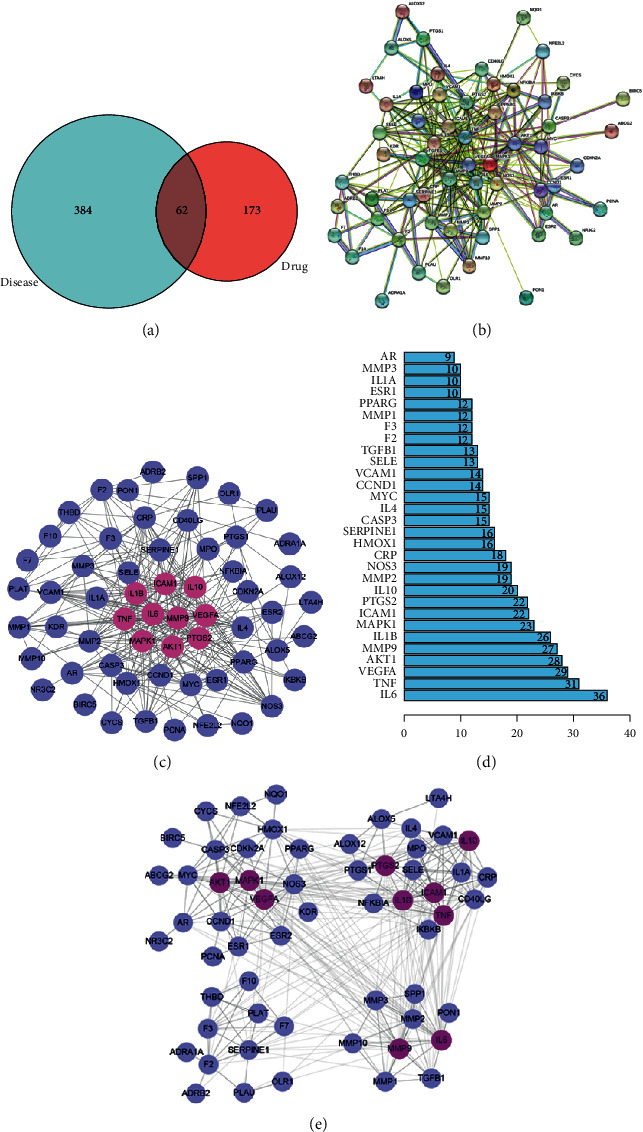
Figure 2.

Topological analysis of the target proteins of BHD related to IS. (a) Venn diagram showing shared and unique targets of IS and BHD. (b) The protein-protein interaction (PPI) network diagram constructed by the String database. (c) BHD-IS PPI network constructed by Cytoscape. (d) Bar graph of all protein nodes degree related to the targets. (e) Cluster of PPI network. Lilac and rose red circles stand for 62 intersection targets, and the top ten targets are shown in rose red.
