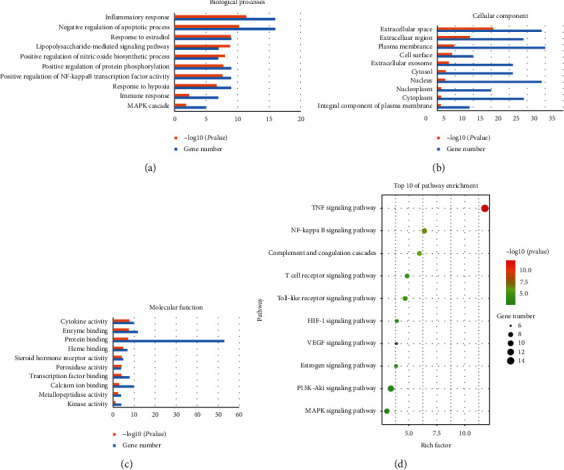
Figure 3.

GO and KEGG PATHWAY enrichment analysis for targets of BHD related to IS. (a) Biological processes. (b) Cellular component. (c) Molecular function. (d) Bubble chart of KEGG PATHWAY analysis. The order of importance was ranked by −log10 (P value) and gene number.
