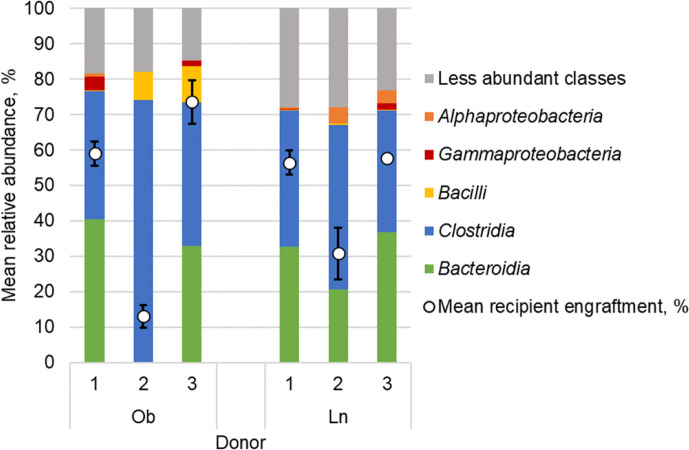
Figure 2.
Fecal microbial composition of obese (Ob) and lean (Ln) human donors represented as mean relative abundance (%) of predominant classes. White circles reflect percent similarity to donor microbiota within 1-week among all mice that received microbiota from each respective donor as determined by SourceTracker; values are mean ± standard deviation.

