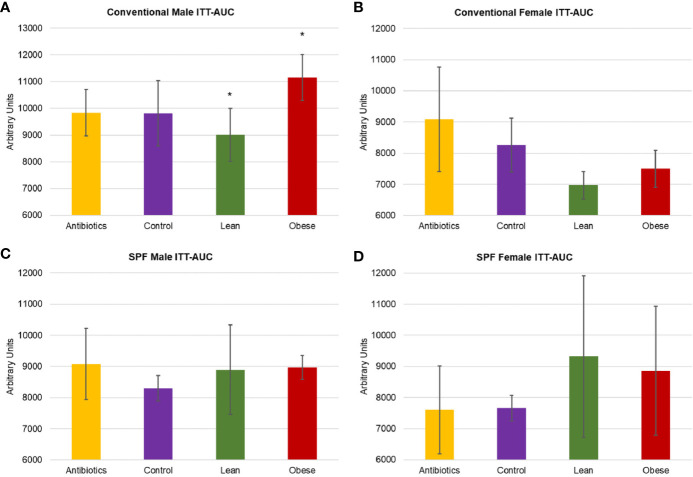
Figure 3.
Metabolic characterization of conventionally housed and SPF mice that received microbiota from obese donor Ob1, microbiota from lean donor Ln1, antibiotics alone, and negative control. (A, C) Male and (B, D) female area under curve (AUC) of insulin tolerance test (ITT) for conventional and specific-pathogen-free (SPF) housing, respectively. Values are mean ± standard deviation (n = 2–5 mice); *P < 0.05 between recipients of microbiota from Ob1 and Ln1.

