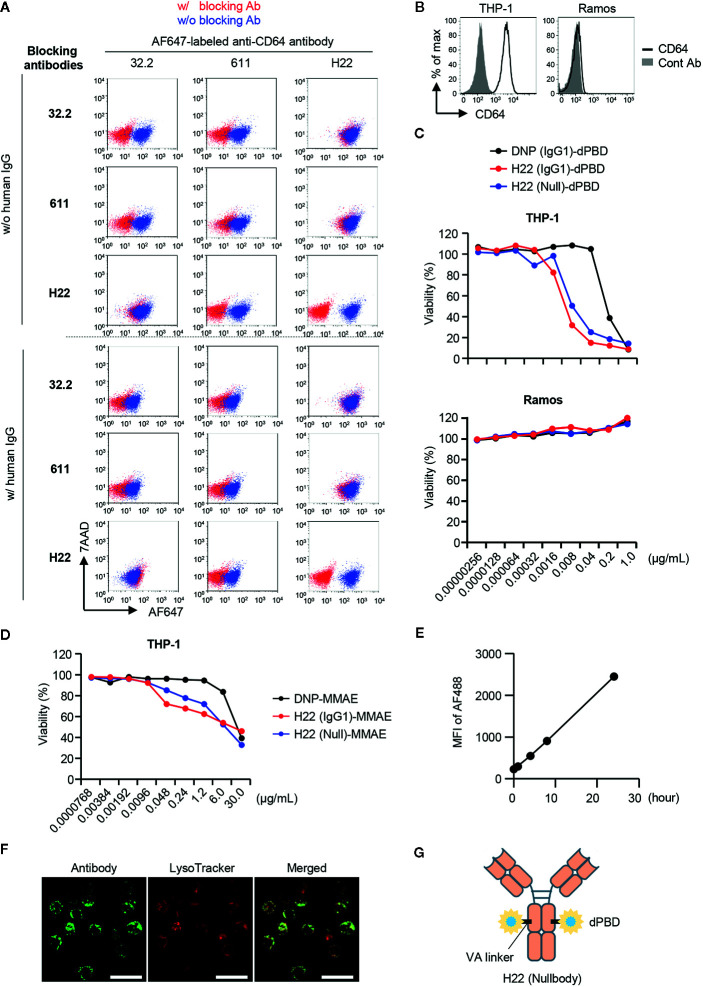
Figure 2.
Selection of antibodies and payloads for ADC construction. (A) Competitive inhibition of anti-CD64 antibodies. Three clones of anti-CD64 antibodies (32.2, 611 and H22) were assessed for their capacities of epitope recognition in the presence of other clones. THP-1 cells were pretreated with blocking antibodies and then stained with Alexa Fluor 647 (AF647)-labeled anti-CD64 antibody in the presence or absence of human IgG. To estimate binding capacity, the signal intensity in the presence of the competitors (red dots) was compared with that in the absence of competitors (blue dots). (B) CD64 expression on THP-1 and Ramos cells. (C) Cytotoxicity assays with H22-dPBD. THP-1 and Ramos cells cultured with different ADCs composed of dPBD and an antibody, such as the anti-DNP antibody humanized with IgG1 (DNP(IgG1)-dPBD), H22 humanized with IgG1 (H22(IgG1)-dPBD), or H22 humanized with nullbody, an IgG4 analogue [H22(Null)-dPBD], in the presence of 20% human serum for 4 days. The relative viability of cells was estimated based on the quantification of ATP. (D) Cytotoxicity assay with H22-MMAE. THP-1 cells were cultured with ADCs composed of MMAE and an antibody, such as the anti-DNP antibody humanized with IgG1 [DNP(IgG1)-MMAE], H22 humanized with IgG1 (H22(IgG1)-MMAE) or H22 humanized with IgG4 nullbody (H22(Null)-MMAE), in the presence of 20% human serum for 4 days. Relative viability was estimated based on the quantification of ATP. (E) Internalization of H22 nullbody by U937 cells. Cells were pre-cultured with Alexa Fluor 488-labeled H22 antibody for the indicated times. The cells were then incubated with a quenching antibody on ice for 1 h and the signal intensity of Alexa Fluor 488 (AF488) was measured by FCM. (F) Internalization of H22 nullbody into primary monocytes. CD14hiCD16- monocytes sorted from peripheral blood were stained with the AF647-labeled H22 nullbody. The cells were then cultured for 23 h after reaction with the H22 nullbody and stained with LysoTracker (100 nM) for 1 h. Cell images were obtained by confocal microscopy. Scale bar, 20 µm. (G) A schematic illustration of the structure of H22-dPBD. Data are representative of two (A–E) or three (F) independent experiments.

