Figure 3.
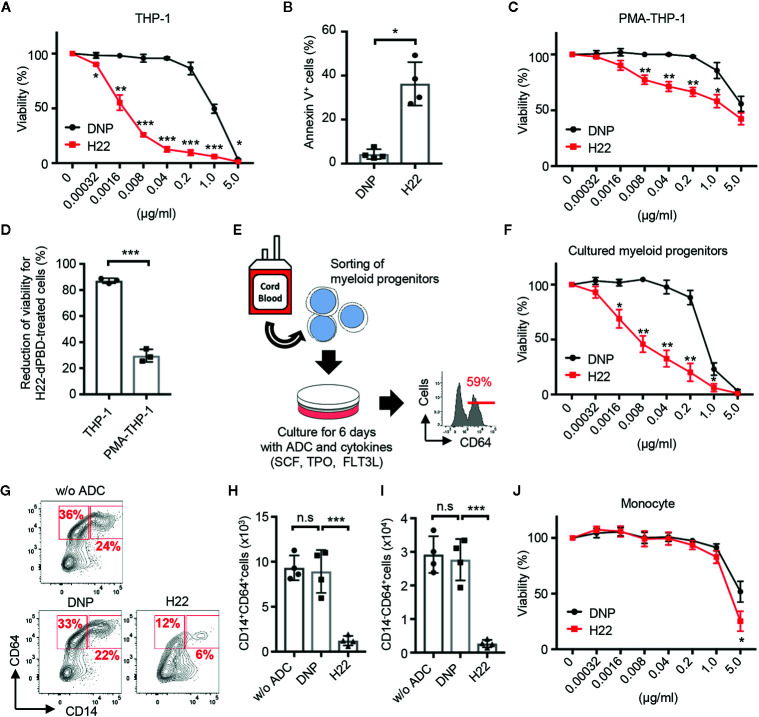
Preferential cytotoxic activity of H22-dPBD against monocytic progenitors, but not monocytes. (A) Evaluation of cytotoxic activity of H22-dPBD against THP-1 cells. THP-1 cells were cultured for 6 days in the presence of DNP-dPBD or H22-dPBD and their relative viability was estimated based on the quantification of ATP (n=3). (B) Induction of apoptosis by H22-dPBD. THP-1 cells were cultured with ADCs (0.04 µg/ml) for 3 days and the frequency of apoptotic cells was evaluated by FCM (n=4). (C) Killing activity of H22-dPBD against PMA-treated THP-1 cells. THP-1 cells were stimulated with 40 ng/ml PMA for 24 h prior to culture with the ADC and the susceptibility of cells to H22-dPBD was examined as shown in (A) (n=3). (D) Killing efficacy of H22-dPBD treatment against THP-1 cells and PMA-treated THP-1 cells. Normalized reduction of cell viability was calculated from the data of treatment with 0.04 μg/ml ADCs in (A) and (C) (n=3). (E) Experimental scheme of the killing assay against myeloid progenitors. Lin-CLEC12A+ myeloid progenitors were sorted from UCB and were cultured with ADCs and cytokines (100 ng/ml SCF, 50 ng/ml TPO and FLT3L). The number on the histogram indicates the mean frequency of CD64+ progenies yielded through 6-day culture (n=3). (F) Cytotoxic activity of H22-dPBD against cells generated from Lin-CLEC12A+ progenitors at day 6. Relative viability was assessed based on the quantification of ATP (n=3). (G–I) FCM analysis of CD64+ cells from Lin-CLEC12A+ myeloid progenitors. Cells were cultured with cytokines and 0 or 0.008 µg/ml ADC for 6 days and the numbers of CD14+ monocytes (H) and CD14-CD64+ monocytic progenitors (I) were determined. (J) Cytotoxic activity of H22-dPBD against mature monocytes. CD14hiCD16- monocytes were sorted from the peripheral blood of healthy donors and were cultured for 6 days in the presence or absence of ADC (n=4). The data were pooled from three (A, D) or four (B, J) independent experiments or are representative of two (F) or three (C, E, G–I) independent experiments. Multiple t-test (A, C, F, J), Student’s t-test (B, D) and one-way ANOVA (H, I) were used to assess statistical significance. Error bars represent standard deviation of the mean. *p < 0.05, **p < 0.01, ***p < 0.001; n.s, not significant.

