Figure 5.

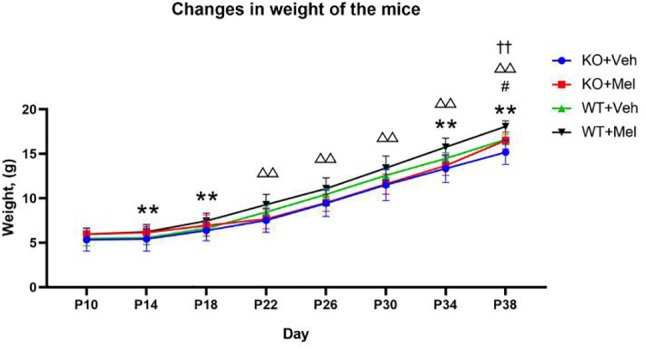
Changes in weight of the mice: **P < 0.001 for WT+Mel vs. WT; △△P < 0.001 for KO+Mel vs. WT+Mel; #P < 0.05 for KO+Mel vs. KO; ††P < 0.001 for KO vs. WT. [Three-way ANOVA, Bonferroni post hoc test (details are shown in text)].

Changes in weight of the mice: **P < 0.001 for WT+Mel vs. WT; △△P < 0.001 for KO+Mel vs. WT+Mel; #P < 0.05 for KO+Mel vs. KO; ††P < 0.001 for KO vs. WT. [Three-way ANOVA, Bonferroni post hoc test (details are shown in text)].