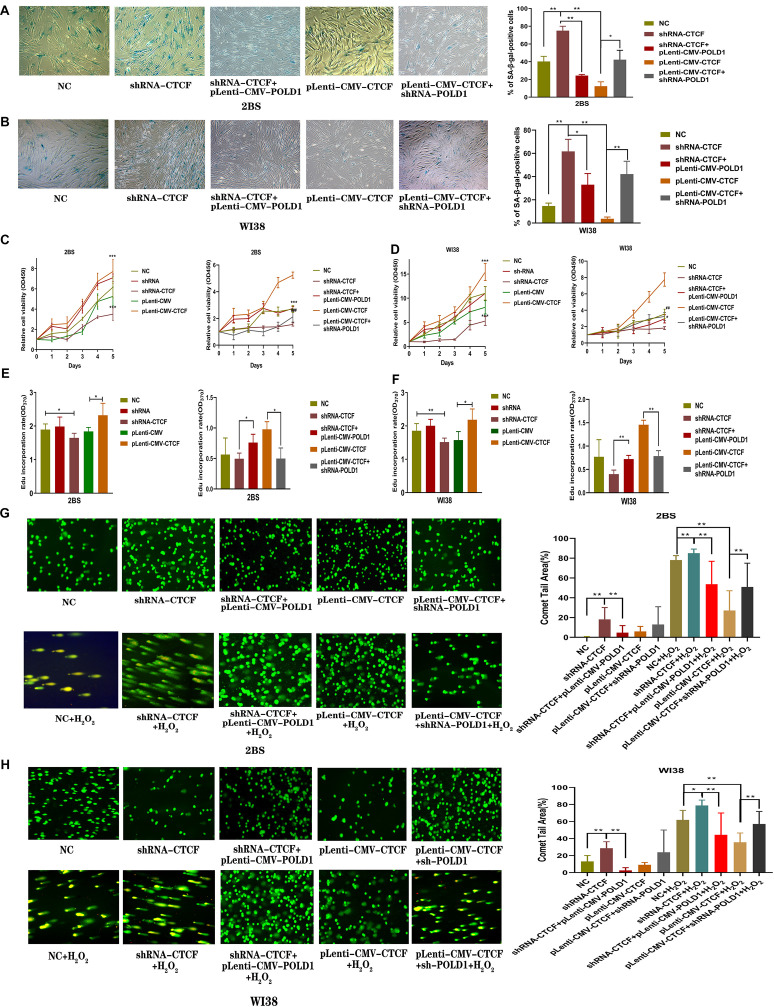
FIGURE 6.
CCCTC-binding factor (CTCF) was involved in the progression of cellular senescence, and DNA polymerase delta 1, catalytic subunit (POLD1) rescued the effect of the downregulated CTCF on aging. (A,B) Senescence-associated β-galactosidase (SA-β-gal) staining of 2BS (A) and WI38 cells (B) transfected with the indicated lentivirus. The percentage of SA-β-gal-positive cells counted in each condition was shown. The experiments shown are representative of three biological replicates. Data were compared by Student’s t-test; *P < 0.05, **P < 0.01. (C,D) Proliferation of 2BS and WI38 cells transfected with the indicated lentivirus measured by Cell Counting Kit-8 (CCK-8) assay. The absorbance at 450 nm was measured at 0–5 days. Data are shown as the mean ± SEM of the ratio for the absorbance. Data were compared by Student’s t-test, and data are shown as the mean ± SEM, with three independent experiments in each group; ***P < 0.005 vs. the NC group; ##P < 0.01, ###P < 0.005, Lenti-CMV-CTCF vs. pLenti-CMV-CTCF + shRNA-POLD1. (E,F) An 5-ethynyl-2′-deoxyuridine (EdU) incorporation assay was used to detect the rate of DNA synthesis. EdU-positive cells were quantified after 72 h of treatment by the ratio of the absorbance at 370 nm. Data were compared by one-way ANOVA and Student’s t-test, and data are shown as the mean ± SEM, with three independent experiments in each group; *P < 0.05, **P < 0.01. (G,H) Effects of altered CTCF expression on DNA damage in 2BS and WI38 cells transfected with the indicated lentivirus (magnification, × 100). The percentage of the tail area determined by CAPS software (n = 50). Data were compared by one-way ANOVA and Student’s t-test, and data are shown as the mean ± SEM. *P < 0.05, **P < 0.01.

