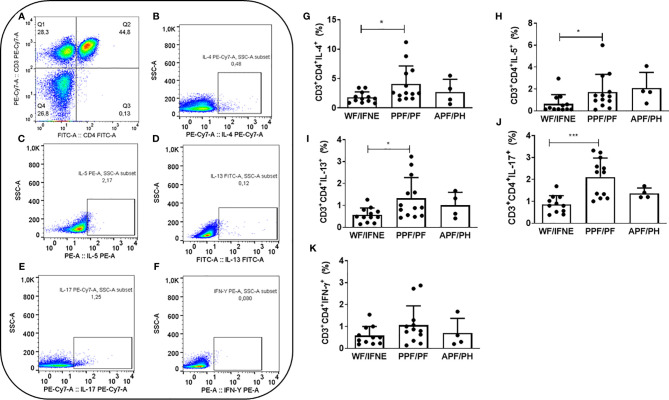
Figure 1.
Representative plots of one experiment showing the frequency of CD4+ T lymphocytes (A) and the expression of IL-4 (B), IL-5 (C), IL-13 (D), IL-17 (E), and IFN-γ (F). Frequency of CD4+ T lymphocytes expressing IL-4 (G), IL-5 (H), IL-13 (I), IL-17 (J), IFN-γ (K) after SEA stimulation from individuals without fibrosis and with different degrees of periportal fibrosis secondary to schistosomiasis *p <0.05, ***p <0.005 (Mann-Whitney test).The histogram and bars represent the mean + SD.

