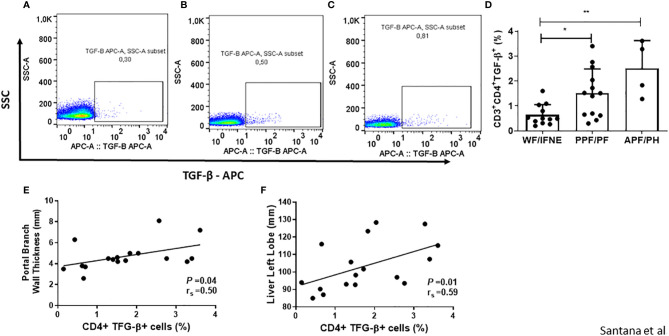
Figure 3.
Representative plots of one experiment showing the frequency of CD4+TGF-β+ T lymphocytes in the different groups (A–C). Frequency of CD4 T lymphocytes expressing TGF-β after SEA stimulation from individuals without fibrosis and with different degrees of periportal fibrosis secondary to schistosomiasis (D). Correlations between this value and the portal branch wall thickness or the size of the liver left lobe of the patients that shows some level of fibrosis (E, F). Spearman’s rank correlation coefficient (rs) and P value is shown. *p < 0.05 **p < 0.01.

