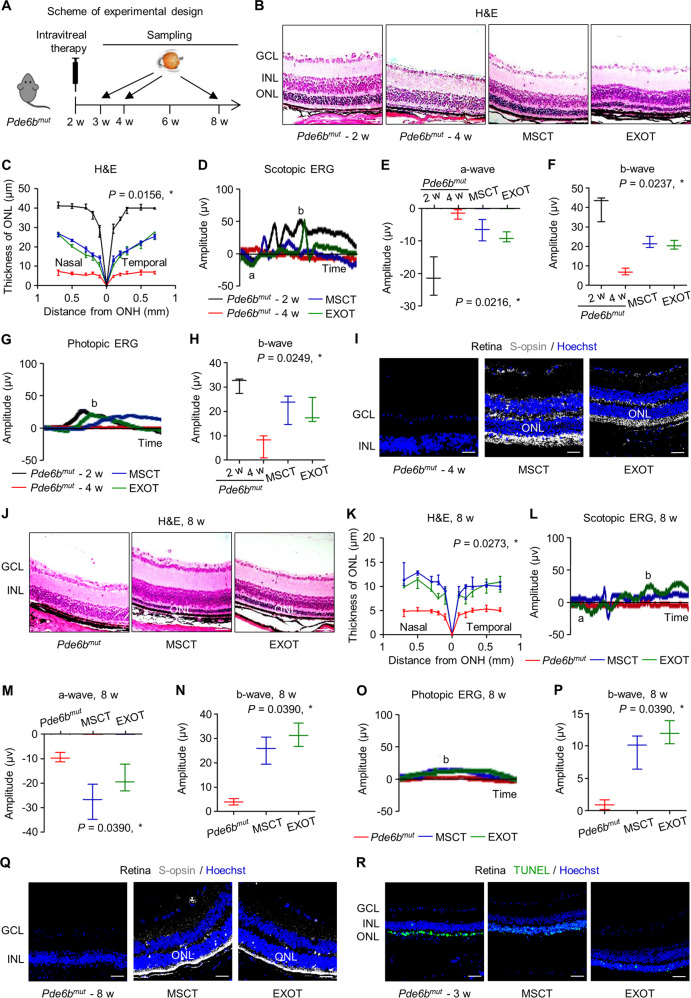
Fig. 4. Intravitreal transplantation of mesenchymal stem cells (MSCs) and exosomes (EXO) ameliorates photoreceptor loss and retinal degeneration in the Phosphodiesterase 6b gene mutant (Pde6bmut) mouse model.
A Schematic diagram demonstrating the study design of in vivo experiments on Pde6bmut retinal degeneration. Representative hematoxylin and eosin (H&E) staining images of retinal tissues (B) and the corresponding quantitative analysis of ONL thickness (C). MSCT mesenchymal stem cell transplantation, EXOT exosomal transplantation, GCL ganglion cell layer, ONH optic nerve head. Scale bars = 50 μm. *P < 0.05 by the Kruskal–Wallis test for area under curve (AUC). N = 3 per group. Representative scotopic electroretinography (ERG) waveforms (D) and the corresponding quantitative analyses of amplitude changes of a-wave (E) and b-wave (F). *P < 0.05 by the Kruskal–Wallis tests. N = 3 per group. Representative photopic ERG waveforms (G) and the corresponding quantitative analysis of b-wave amplitude changes (H). *P < 0.05 by the Kruskal–Wallis tests. N = 3 per group. I Representative immunofluorescent (IF) staining images of retinal tissues showing cone photoreceptor bodies (white) counterstained by Hoechst 33342 (blue). Scale bars = 25 μm. Representative H&E staining images of retinal tissues (J) and the corresponding quantitative analysis of ONL thickness (K). Scale bars = 50 μm. *P < 0.05 by the Kruskal–Wallis test for AUC. N = 3 per group. Representative scotopic ERG waveforms (L) and the corresponding quantitative analyses of amplitude changes of a-wave (M) and b-wave (N). *P < 0.05 by the Kruskal–Wallis tests. N = 3 per group. Representative photopic ERG waveforms (O) and the corresponding quantitative analysis of b-wave amplitude changes (P). *P < 0.05 by the Kruskal–Wallis tests. N = 3 per group. Q Representative immunofluorescent (IF) staining images of retinal tissues showing cone photoreceptor bodies (white) counterstained by Hoechst 33342 (blue). Scale bars = 25 μm. R Representative terminal deoxynucleotidyl transferase dUTP nick end labeling (TUNEL, green) staining images of retinal tissues counterstained by Hoechst 33342 (blue). Scale bars = 50 μm. Data represent median ± range for (C), (E), (F), (H), (K), (M), (N), and (P).

