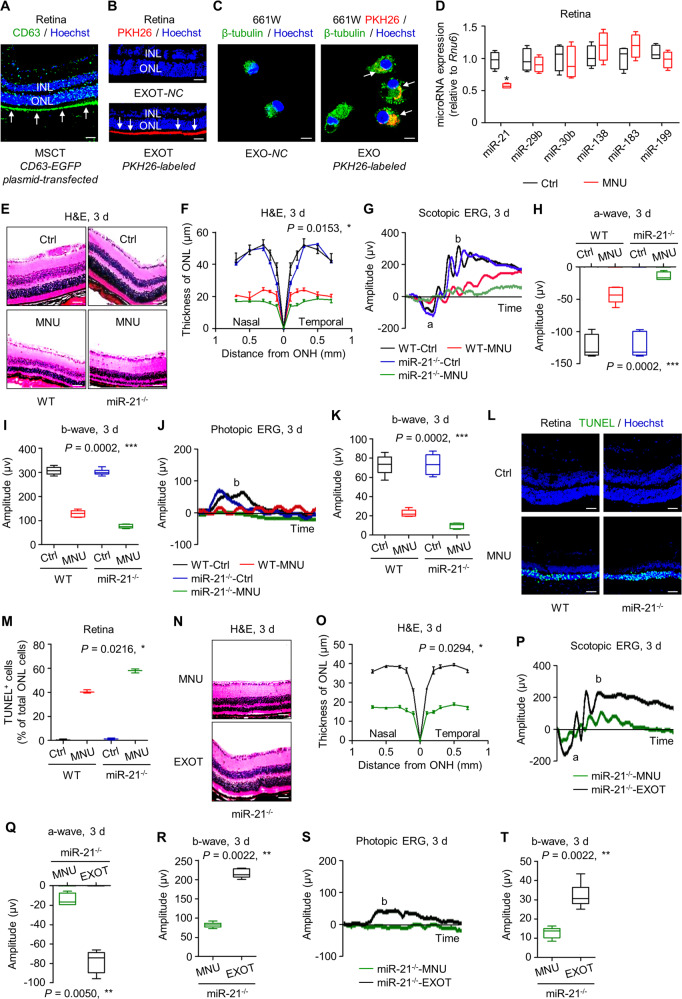
Fig. 5. miR-21 deficiency aggravates N-methyl-N-nitrosourea (MNU)-induced photoreceptor apoptosis and retinal degeneration, which is restrained by transplantation of mesenchymal stem cell (MSC)-derived exosomes.
A Tracing of CD63-EGFP plasmid-transfected MSCs (green, CD63) in the retina tissue counterstained by Hoechst 33342 (blue) after intravitreal injection for 24 h. MSCT mesenchymal stem cell transplantation, INL inner nuclear layer, ONL outer nuclear layer. Scale bar = 50 μm. B Tracing of PKH26-labeled exosomes (red) in the retina tissue counterstained by Hoechst 33342 (blue) after intravitreal injection for 24 h. EXOT exosomal transplantation, NC negative control, injection of EXO without staining. Scale bar = 50 μm. C Tracing of PKH26-labeled, MSC-derived exosomes (red) in 661W cone photoreceptor cells during in vitro treatment. 661W cells are demonstrated by β-tubulin immunostaining for microtubules (green), counterstained by Hoechst 33342 (blue). NC negative control, treatment of EXO without staining. Scale bar = 10 μm. D Quantitative real-time polymerase chain reaction (qRT-PCR) analysis of expression levels of multiple microRNAs in retina tissues, normalized to Rnu6. Ctrl control. *P < 0.05 by the Mann–Whitney U test. N = 4 per group. Representative hematoxylin and eosin (H&E) staining images of retinal tissues (E) and the corresponding quantitative analysis of outer nuclear layer (ONL) thickness (F). WT wild-type mice, miR-21−/− mice deficient for miR-21, ONH optic nerve head. Scale bars = 50 μm. *P < 0.05 by the Kruskal–Wallis test for area under curve (AUC). N = 3 per group. Representative scotopic electroretinography (ERG) waveforms (G) and the corresponding quantitative analyses of amplitude changes of a-wave (H) and b-wave (I). *P < 0.05 by the Kruskal–Wallis tests. N = 6 per group. Representative photopic ERG waveforms (J) and the corresponding quantitative analysis of b-wave amplitude changes (K). *P < 0.05 by the Kruskal–Wallis tests. N = 6 per group. Representative terminal deoxynucleotidyl transferase dUTP nick end labeling (TUNEL, green) staining images of retinal tissues counterstained by Hoechst 33342 (blue) (L) and the corresponding quantitative analysis of percentages of TUNEL+ cells over total ONL cells (M). Scale bars = 50 μm. *P < 0.05 by the Kruskal–Wallis test. N = 3 per group. Representative H&E staining images of retinal tissues (N) and the corresponding quantitative analysis of ONL thickness (O). miR-21-deficient mice were treated by MNU with or without EXOT. Scale bars = 50 μm. *P < 0.05 by the Mann–Whitney U test for AUC. N = 3 per group. Representative scotopic ERG waveforms recorded for retinal functional analysis (P) and the corresponding quantitative analyses of amplitude changes of a-wave (Q) and b-wave (R). *P < 0.05 by the Mann–Whitney U tests. N = 6 per group. Representative photopic ERG waveforms (S) and the corresponding quantitative analysis of b-wave amplitude changes (T). *P < 0.05 by the Kruskal–Wallis tests. N = 6 per group. Data represent median ± range for (F), (M), and (O). Data are represented as box (25th, 50th, and 75th percentiles) and whisker (range) plots for (D), (H), (I), (K), (Q), (R), and (T).

