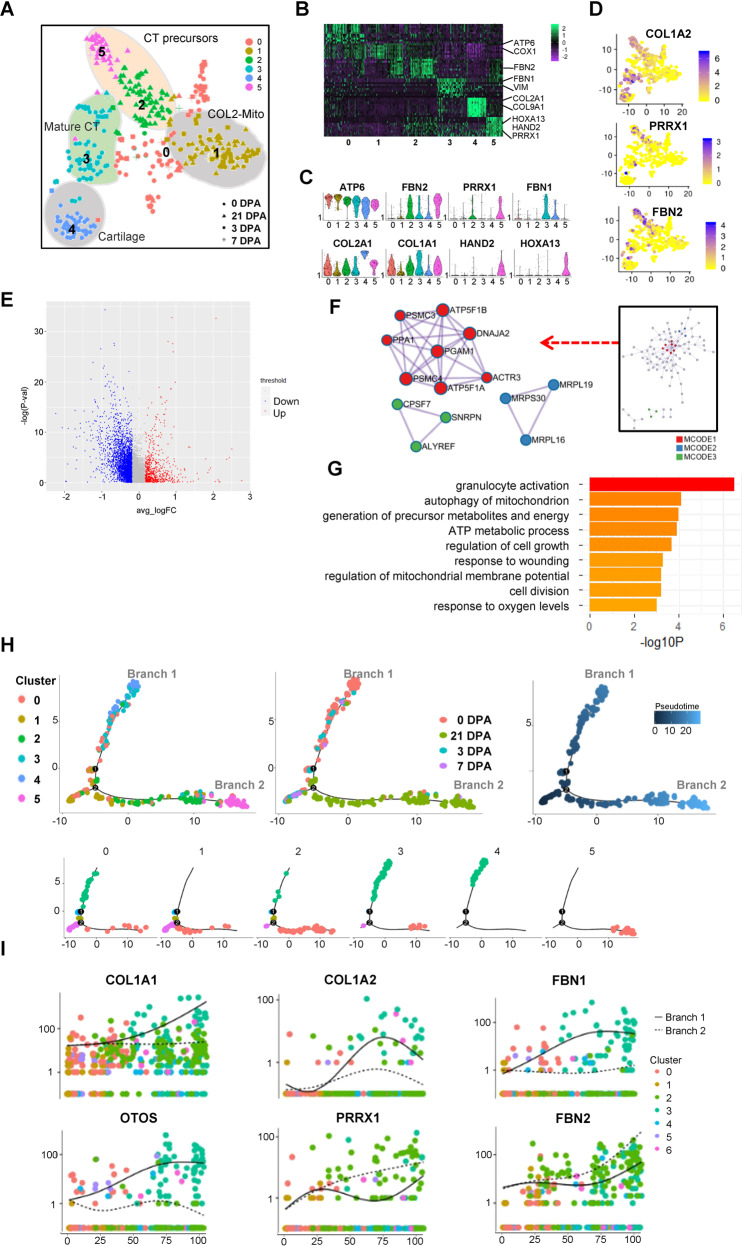
Fig. 6. ScRNA-seq analysis revealed COL2-mito subcluster in COL2A1+ cells during the regeneration process.
A T-distributed stochastic neighbor embedding (t-SNE) visualizations of COL2A1+ cells subclusters identified using the computational pipeline. B Heatmap of top 10 differentiated gene of six subclusters. C Violin plots of subclusters’ marker genes. D Feature Plot of CT marker genes’ expression in individual cells. E Volcano plot of the differentiation gene expression of COL2-mito subcluster and the other subclusters. F The protein–protein interaction network analyzed by the molecular complex detection (MCODE) algorithm. G −Log p values for each GO term are shown as histograms. Bars color-coded according to −Log p value, ranging from low detected to the highest detected levels (yellow and red). H Pseudotime ordering of single cells using 2D PCA. Each data point represents a single cell colored by cluster in A (left), ampution time points (middle), and pseudotime (right). I Expression profiles of skeleton system marker genes, different cell signaling pathway components, and blastema marker genes along pseudotime ordered byseven clusters in (A).

