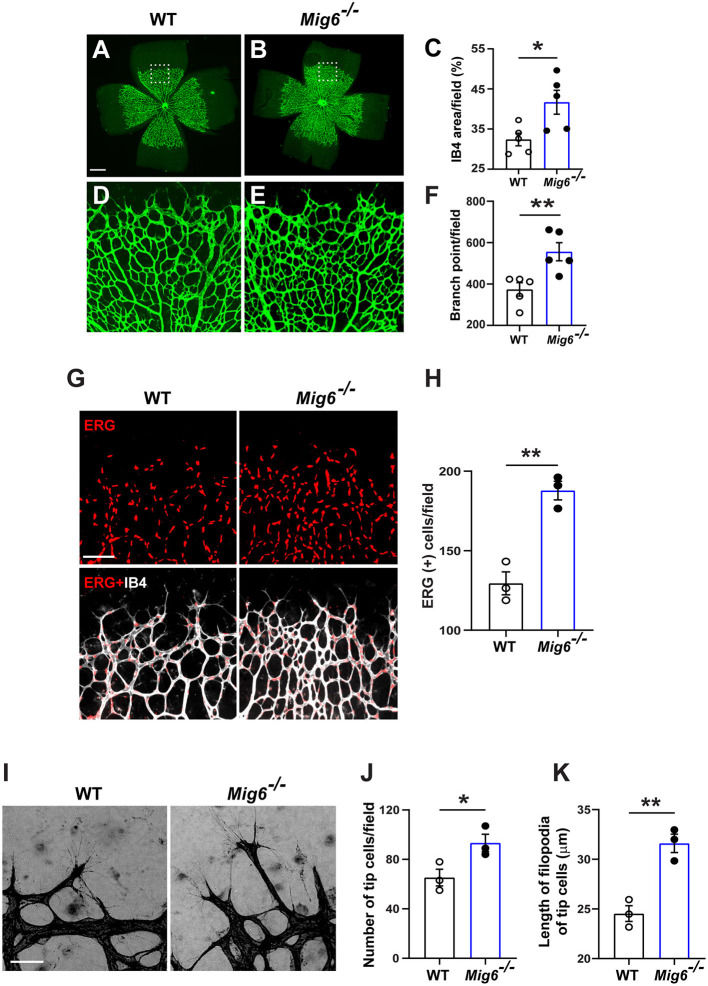
Figure 1.
Increased retinal angiogenesis in Mig6 deficient mice. (A,B) Representative images of whole mount retinae of wild-type (WT) and Mig6−/− mice at P5 stained for IB4 (green). (C) Quantification of retinal blood vessel densities stained with IB4 in WT and Mig6−/− mice (n = 5 fields per retina). (D,E) Higher magnification of dotted regions in whole mount retinae of WT (D) and Mig6−/− (E) mice. (F) IB4 staining (green) in (D) and (E) showing more vascular branch points in the retinae of Mig6−/− mice at P5 (n = 5 fields per retina). (G) Whole mount retinae co-stained for ERG (red) and IB4 (white) to label endothelial cells in WT and Mig6−/− mice at P5. (H) Quantification of ERG+ ECs in the front of retinal vascular plexus (n = 3 fields per retina) in WT and Mig6−/− mice at P5. (I) Images of retinal blood vessel tip cells and their filopodia extensions at the angiogenic front of WT and Mig6−/− retinae at P5. (J) Quantification of the number of retinal blood vessel tip cells per field (n = 3 fields per retina) in WT and Mig6−/− mice at P5. (K) Measurement of the length of filopodia of tip cells per field (n = 3 fields per retina). Scale bars: 50 μm for (A) and (I); 100 μm for (G). Data represent mean ± SEM. * p < 0.05, ** p < 0.01 (two-tailed paired Student's t-test).

